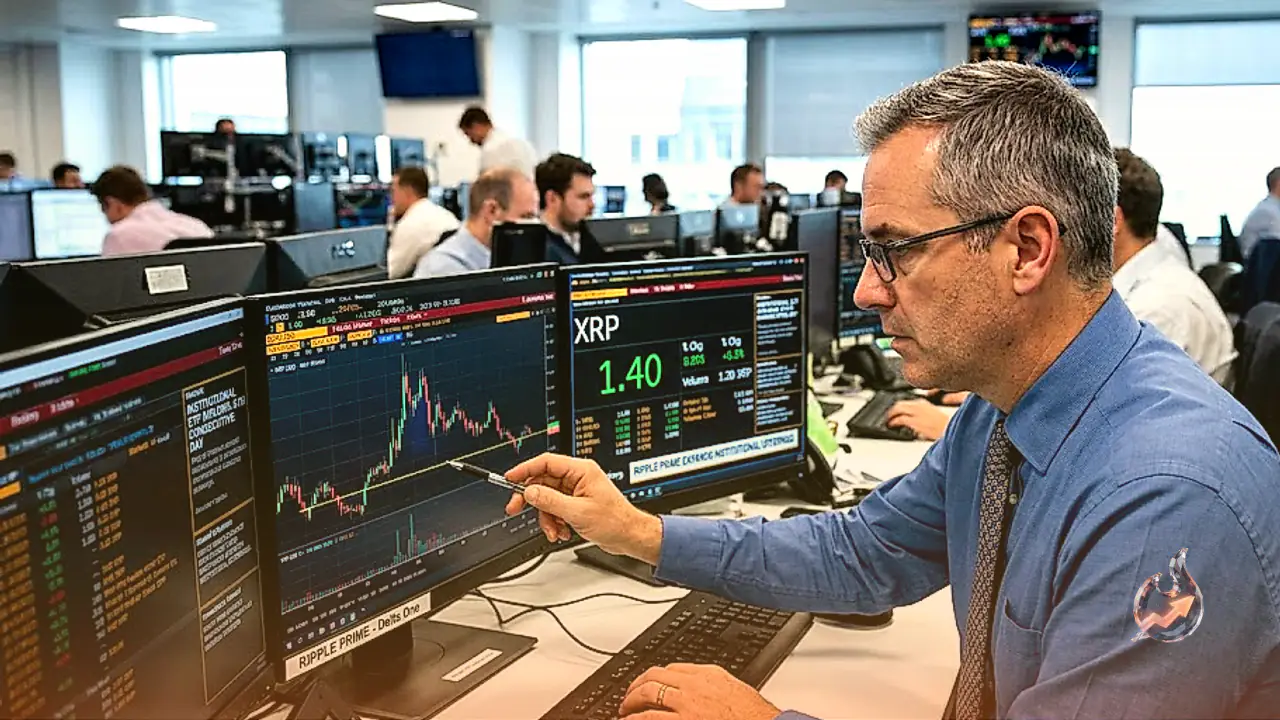

























Ether kicked off the week with a burst of buying, climbing more than 7% on Tuesday to push back above $1,850 after a cooler-than-expected inflation print out of the United States revived appetite for riskier assets. The rally in the largest altcoin was really set in motion on Monday, when fresh US inflation data for June came in softer than the market had braced for.
What the inflation data actually showed
Headline inflation cooled to 3.5%, well under the 3.8% that forecasters had penciled in. On a month-on-month basis, prices slipped 0.4%, the sharpest monthly drop since May 2020. Core CPI, which strips out volatile food and energy costs, also undershot, landing at 2.6% against expectations of 2.8%. For a market that had spent weeks fretting about sticky prices keeping policy tight, the numbers were a clear relief, and traders wasted little time repositioning.
Short sellers get squeezed
The speed of the move caught bears badly offside. Traders who had bet on ETH falling in the futures market were forced to cover, and roughly $113 million worth of short positions were wiped out in liquidations over the previous 24 hours. That forced buying poured extra fuel on the rally. The gains also built on a milder recovery that had been quietly taking shape over the past week, as sentiment across risk assets improved.
Whales and retail aren't chasing
For all the excitement in the price, the people holding the coins have barely budged. Balances in both retail and whale wallets have shifted only slightly. In fact, wallets holding between 100 and 1,000 ETH and those holding 1,000 to 10,000 ETH trimmed their combined stash by about 30,000 ETH over the past week. In other words, neither the big players nor the smaller ones are rushing to buy into this bounce.
Demand from US buyers is cooling again after a brief pickup. The Coinbase Premium Index, a gauge of how eager American traders are relative to the rest of the market, slid to -0.121 on Monday, a negative reading that points to fading local momentum.
Leverage is doing the heavy lifting
The derivatives market tells a different story. Open interest, the total value of outstanding contracts, jumped by roughly 680,000 ETH to 14.41 million ETH on Tuesday, its highest in more than a month. That surge signals leveraged bulls are piling back in, and it is their money, rather than spot buyers, driving much of the advance. Funding rates have tilted positive, a pattern that has held since ETH began recovering earlier in the month.
Where the charts stand
On the daily chart the near-term picture leans constructive. Live market data shows ETH last changing hands around $1,880, up about 6% from the previous close of $1,774, holding above its 20-day and 50-day EMAs near $1,755 and $1,802. The 100-day EMA at $1,948 is acting as a ceiling. The RSI sits at 64 and the Stochastic is stretched near 96, both pointing to firm bullish momentum, though such overbought readings warn the climb could lose steam as price nears resistance. The upper Bollinger Band sits right at $1,909, matching the first resistance level.
Levels to watch
On the way up, the first hurdle is the horizontal barrier at $1,909, followed by $2,018 and $2,107, with a heavier band of resistance clustered around $2,211 and $2,388. On the way down, immediate support comes in at $1,806 and the 50-day EMA at $1,802, backed by the 20-day EMA at $1,755 and the $1,741 shelf that has already produced another bounce. If those give way, the next downside targets sit at $1,524 and $1,404.
The wider crypto board
Ether isn't moving in isolation. Ripple (XRP) showed faint signs of life above $1.05 on Tuesday, edging to around $1.07 and snapping a three-day losing streak in an otherwise pressured market. Bitcoin, meanwhile, drifted in sideways trade around $62,500, while both Ethereum and Ripple clung to key support at $1,700 and $1.05 respectively, a sign of broad consolidation across the sector. Curve DAO was the standout, up 4% on Tuesday on top of a 3% gain the day before to lead altcoins over 24 hours, as exchange supply thinned and larger holders added to their positions. Not everything was green, though: Bitcoin came under renewed pressure at $62,600 after sliding more than 2%, weighed down by fresh geopolitical friction between the US and Iran that dented risk appetite.