























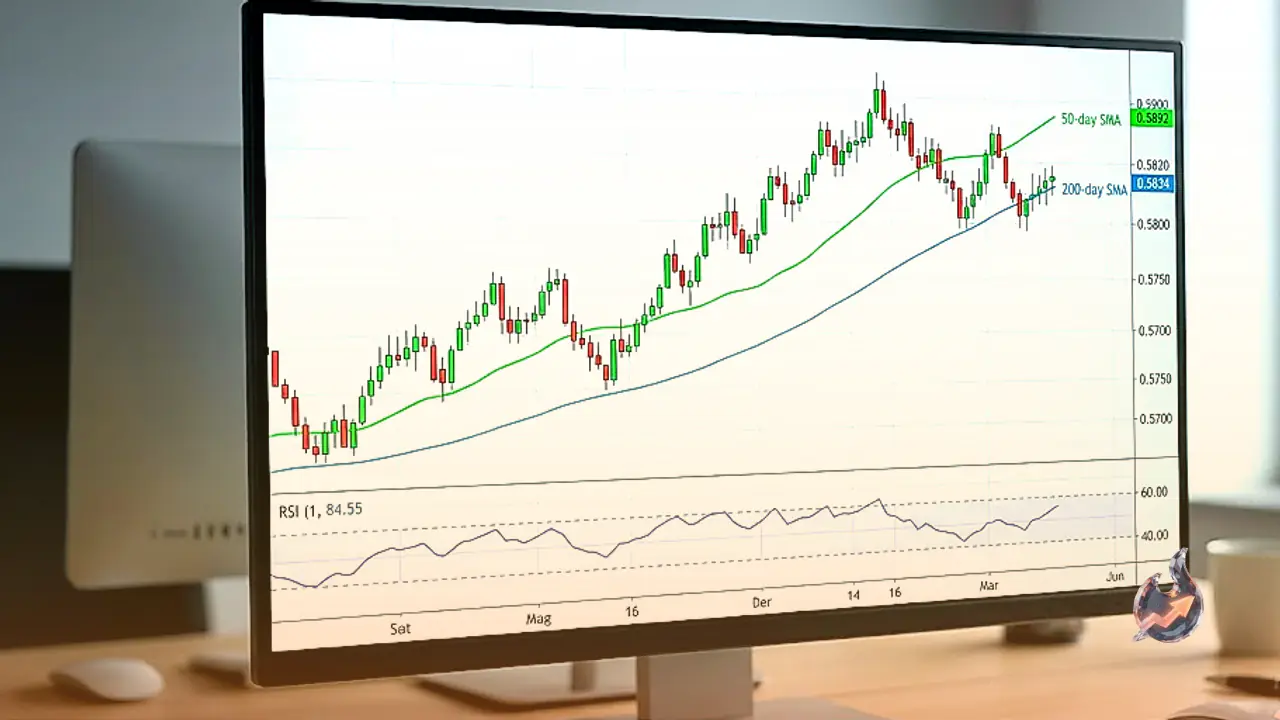

The New Zealand Dollar's push higher against the US Dollar has run out of fuel at exactly the spot where the market's two most closely watched lines, the 50- and 200-day Simple Moving Averages (SMAs), sit almost on top of each other and form a stubborn ceiling. According to live market data, NZD/USD is currently trading around 0.5763, up a slim 0.08 percent from its previous close of 0.5759. In other words, the pair is stuck, neither breaking cleanly higher nor falling apart.
The whole story right now revolves around those two moving averages. They are clustered together between roughly 0.5814 and 0.5819 and are acting like a wall for buyers. The broader trend is still pointing lower, with the pair holding below both averages.
Where the pair stands now
Earlier in the session, NZD/USD touched a daily high of 0.5843 and looked ready to clear the 200-day SMA for good. But sellers stepped in right at that moment and pushed spot prices back toward the 0.5800 figure. That is the tug of war that has kept this pair boxed in for several sessions, buyers trying to lift it and sellers fading every bounce.
Getting to that wall was not a straight line either. Price action consolidated around 0.5750 for three days before the next leg up carried it to 0.5800. That kind of drawn-out pause often signals that the market is quietly storing energy ahead of its next big move.
Momentum quietly turning
Even with price stuck in a range, buyers appear to be gaining the upper hand under the surface. The Relative Strength Index (RSI) turned bullish on July 9, a sign that buyers are regaining momentum. Live readings now put the RSI near 53, which is neither overbought nor a sign of weakness. That balanced level suggests the pair still has room to run higher if a fresh wave of buying shows up.
The upside map
If NZD/USD clears the confluence of the 50- and 200-day SMAs, the next target becomes the 100-day SMA at 0.5834. A breach of that level would then expose the March 19 daily high at 0.5892, sitting just below the psychological 0.5900 mark that bulls would treat as a real win. Should the strength continue past that, the next area of interest would be the February 26 high at 0.6014. Put simply, the 0.59 handle is the buyers' biggest ambition for now.
The downside risks
On the other side, if pressure builds, the first test comes at the low of the day (LOD) at 0.5744. A break below that could exacerbate a drop toward the 0.5700 level. Beneath that, the next area of demand is the July 8 daily low at 0.5672, where buyers could re-emerge. So on the downside, 0.5744 and then 0.5672 are the two key floors the market will be watching.
The Kiwi across the majors this week
Against the major currencies, the New Zealand Dollar had a mixed week, but it was strongest against the Japanese Yen. A currency's true strength only becomes clear when it is measured across several pairs, and the Kiwi's firmness against the Yen hints that there are still some buyers willing to back the risk-linked currencies.
The wider currency picture
The Kiwi's move cannot be read in isolation, because the mood across the entire currency market is being set by the health of the US Dollar. The British Pound firmed against the US Dollar on Tuesday, trimming previous losses to return to the 1.3375 area. It is now aiming to retest resistance at the key 200-day SMA, which lies a few pips below 1.3400 and has been capping the Pound's recovery over the last two weeks.
The Dollar weakened against the Euro too. EUR/USD first climbed to multi-day peaks past 1.1460 and then slipped back toward the low 1.1400s as Tuesday's North American session drew to a close. Declining bets for potential Fed tightening later in the year, coupled with poor US CPI data, hurt the US Dollar and lent fresh legs to the pair and the broader risk-linked universe. Looking ahead, the release of US PPI and Chair Warsh's second testimony should keep investors busy on Wednesday.
Gold also reversed its recent weakness, reclaiming the area beyond the key $4,000 mark per troy ounce on Tuesday. Following the Greenback's decline and comments from the Fed's Warsh, the precious metal's recovery picked up pace and pushed toward the $4,100 region.
While testifying on the Semiannual Monetary Policy Report before the US House Financial Services Committee, Fed Chairman Kevin Warsh reiterated that the Fed is committed to price stability and its goal of 2 percent inflation. Markets opened July with a December hike as the base case and spent five trading sessions unlearning and relearning it. A 57K payrolls print bled the tightening bets out of the strip, while a re-shut Strait of Hormuz is pushing them back in. Wednesday's minutes from the June FOMC meeting landed in the middle of that round trip, describing a world that had already stopped existing.