





















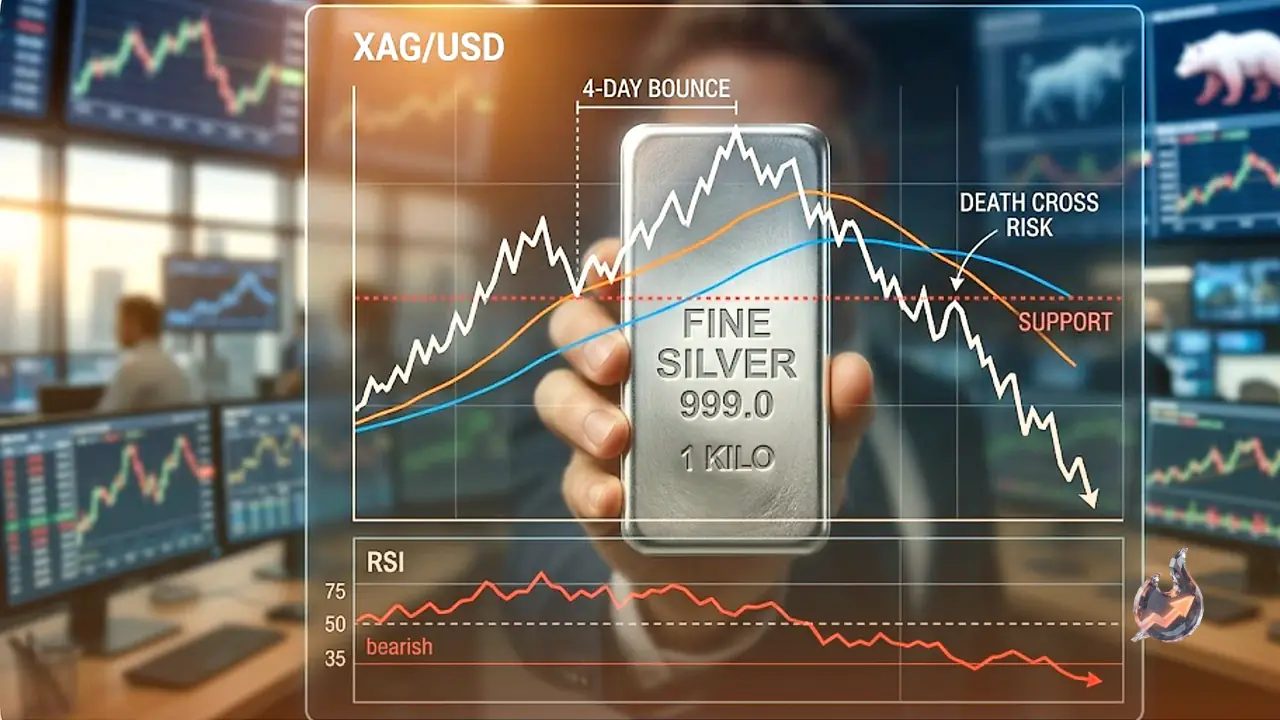

Silver is fighting to keep its recovery alive, but the charts are flashing a warning that the bulls are running low on fuel. After a four-day bounce, the metal's rebound has stalled, and the broader picture stays tilted firmly to the downside. In live trade, XAG/USD is changing hands near $62.46, up roughly 3% from the previous close of $60.64, yet the momentum reading suggests that sellers are quietly stepping back in.
Why the rally lost steam
Silver climbed for four straight sessions last week as buyers slowly built traction, but the move has since gone flat. There are two main reasons the advance ran out of road. First, the geopolitical risk premium that had been baked into prices is now out of the picture, meaning the fear factor that was lifting silver as a safe haven has faded. Second, the daily chart is flagging the risk of a potential death cross, a formation that raises the odds of further losses.
Taken together, the bias on XAG/USD remains downward. The way the trend stalled after four days of strength suggests the buyers no longer have the fuel to push meaningfully higher.
The RSI and momentum signal
On the technical front, the clearest clue comes from the Relative Strength Index. The RSI aimed toward the 50 neutral level, then turned flat and tilted its tip lower, a sign that sellers are moving in. Live readings put the RSI at 42, sitting below the 50 neutral line and keeping the balance leaning toward the bears.
Other indicators paint a mixed but cautious picture. The MACD is below zero at -3.58 against a signal line of -3.66, leaving a slightly positive histogram. The ADX stands at 34, pointing to a market that is genuinely trending, while the Stochastic shows a fast line at 39 and a signal line at 29. The bottom line is that despite the recent bounce, the scales still appear to favour the sellers.
Key support levels to watch
If XAG/USD slips beneath the day's low of $61.45, it clears the path for a deeper slide. From there, price could challenge last week's low of $56.61, which marked June's 30-day trough. Below that level lies the June 24 cycle low of $55.63, and beneath it sits the November 13, 2025 daily high that has since flipped into support at $54.39.
According to live data, the 20-day support sits around $57.03 and resistance near $72.73. For intraday trade, the pivot point is around $62.50, with resistance at R1 $62.55 and R2 $62.63, and support at S1 $62.42 and S2 $62.37. The daily volatility gauge, ATR, reads 2.41, which can be used as a buffer when setting a stop-loss. The Bollinger Bands currently stretch from $55.48 to $72.49, with price trading inside the bands. Over the past 52 weeks, silver has ranged between $36.13 and $121.30.
What silver is and why investors hold it
Silver is a precious metal that trades heavily among investors. Historically, it has served as both a store of value and a medium of exchange. Although it is less popular than gold, traders may turn to silver to diversify their portfolios, for its intrinsic value, or as a potential hedge during periods of high inflation. Investors can buy physical silver in the form of coins or bars, or gain exposure through vehicles such as Exchange Traded Funds that track its price on international markets.
What moves silver prices
Silver prices can shift on a wide range of factors. Geopolitical instability or fears of a deep recession can push the metal higher thanks to its safe-haven status, though to a lesser degree than gold. As a yieldless asset, silver tends to rise when interest rates fall. Its moves also hinge on how the US Dollar behaves, since the metal is priced in dollars, hence the XAG/USD pairing. A strong dollar tends to cap silver's price, while a weaker dollar is likely to propel it higher. Investment demand, mining supply, and recycling rates also feed into the price. Notably, silver is far more abundant than gold.
Silver's industrial backbone
Silver is used widely in industry, particularly in sectors such as electronics and solar energy, because it boasts one of the highest electrical conductivities of any metal, greater than both copper and gold. A surge in demand can lift prices, while a decline tends to drag them lower. The dynamics of the US, Chinese and Indian economies also contribute to price swings. For the US and especially China, their large industrial sectors use silver across many processes, while in India, consumer demand for the metal in jewellery plays a key role in setting prices.
How silver tracks gold
Silver tends to follow gold's lead. When gold rises, silver typically follows suit, since both share a similar safe-haven status. The gold-to-silver ratio, which shows how many ounces of silver equal the value of one ounce of gold, can help gauge the relative valuation of the two metals. Some investors read a high ratio as a sign that silver is undervalued or gold is overvalued. Conversely, a low ratio may suggest that gold is undervalued relative to silver.