
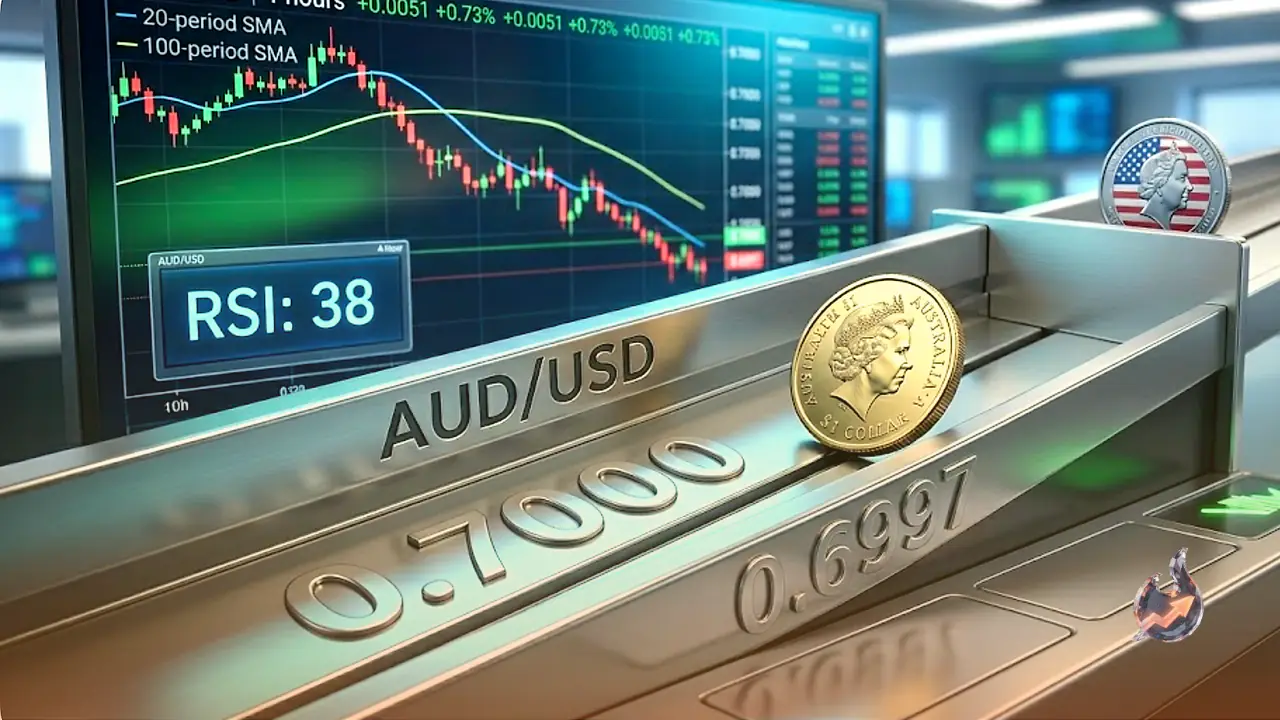

The Australian Dollar has dipped below the psychologically significant 0.7000 mark, with AUD/USD changing hands at 0.6997 on the 4-hour chart as currency markets hold their breath before the release of US Personal Consumption Expenditures (PCE) inflation data. The pair's position beneath key technical levels keeps the near-term outlook firmly tilted to the downside.
Moving Averages and RSI Confirm Bearish Bias
AUD/USD is currently sitting below both the 20-period Simple Moving Average at approximately 0.7013 and the 100-period SMA near 0.7075, with both averages acting as dynamic resistance above the current price. This positioning confirms the prevailing bearish trend in the near term. Adding to the cautious picture, the Relative Strength Index is hovering around 38, a reading that reflects sustained selling pressure and offers no indication that a meaningful recovery is gathering momentum.
Resistance Levels Capping Any Recovery
On the upside, buyers face their first test at 0.7002. Beyond that point, a denser and more formidable cluster of resistance stretches between 0.7013 and 0.7020, where a horizontal cap converges with the 20-period SMA to form a firm ceiling. A sustained and convincing break above this zone would be required before selling pressure begins to ease in any meaningful way. Should such a move occur, the 100-period SMA near 0.7075 would then stand as the next major resistance barrier for any recovery attempt.
Support Levels and Downside Risk
On the lower side, AUD/USD finds its first significant floor at 0.6995, where a horizontal support level offers a near-term buffer against deeper losses. A break below this mark would increase the risk of an accelerated decline, as the next layers of support lie further below with little in between to slow the move.
Note: The technical analysis included in this report was produced with the assistance of an AI tool.