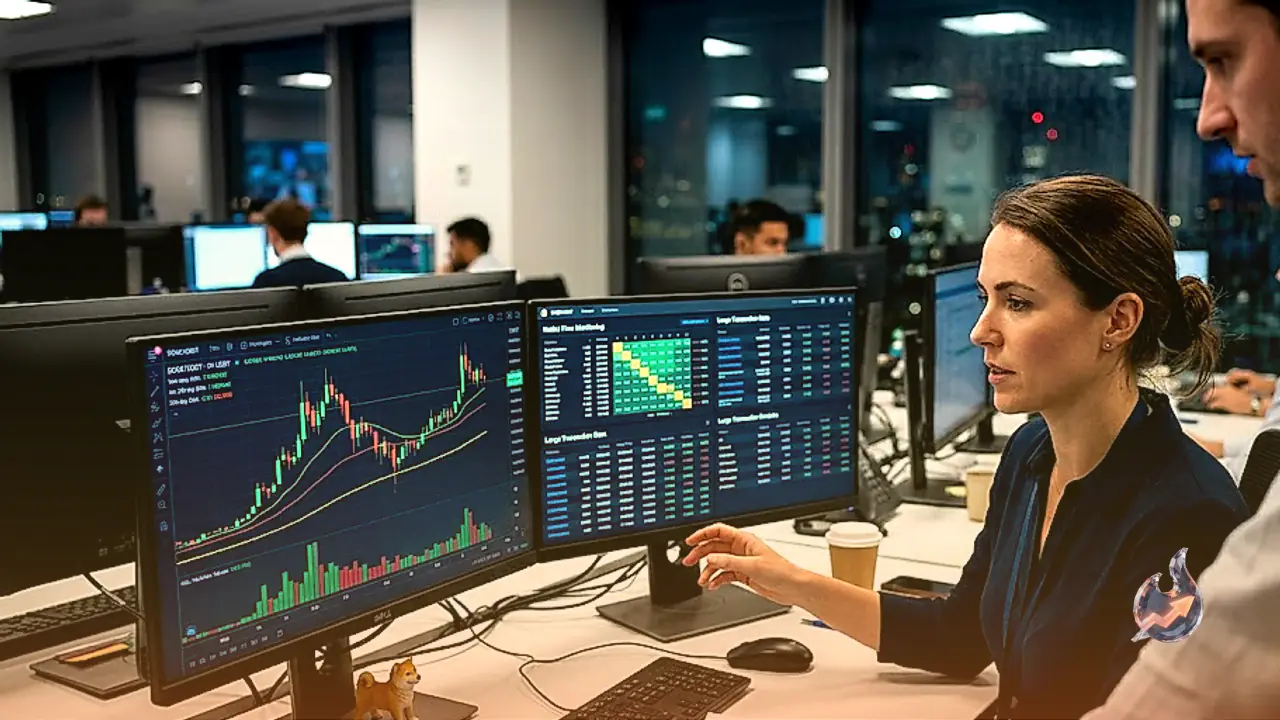

























Cardano (ADA) is currently navigating a period of intense technical gridlock, with its price consolidation indicating a tug-of-war between buyer accumulation and bearish pressure in the derivatives market. During the latest trading session, ADA was valued at $0.1679, representing a minor drop of 0.25% from its previous close of $0.1683. Over the past year, the digital asset has traded within a wide 52-week range of $0.1387 to $0.5143, and the current trading volume stands at 0.74 times the 20-day average. This relatively low volume highlights the general indecision gripping market participants, as neither bulls nor bears have managed to establish a clear dominant trend.
Derivatives Market Flashes Conflicting Signals
The derivatives sector for Cardano presents a highly complex picture, characterized by contrasting sentiment indicators that have left traders guessing. On one hand, the long-to-short ratio for ADA was recorded at 1.07, demonstrating that a slight majority of leverage traders are leaning towards a bullish outcome. When this ratio climbs above one, it typically means that more market participants are entering long positions, betting on an imminent price recovery. However, this optimistic outlook is strongly countered by the funding rates, which flipped negative to stand at -0.014. A negative funding rate indicates that traders holding short positions are actively paying those with long positions to maintain their leverage. This dynamic usually reflects a prevailing bearish bias, suggesting that the underlying market sentiment remains cautious and geared toward further downside.
On-Chain Data Reveals Quiet Whale Accumulation
While the derivatives market remains divided, on-chain metrics offer a glimmer of hope for long-term investors. Data tracks a notable shift in wallet behavior among larger Cardano holders. Specifically, address tiers holding between 1 million and 10 million ADA, as well as those holding between 10 million and 100 million ADA, have collectively acquired 120 million tokens since the beginning of the week. This substantial buy-side pressure from whale wallets suggests that high-net-worth investors view the current low price levels as a viable accumulation zone. In contrast, retail and mid-tier wallets holding between 100,000 and 1 million ADA have remained largely dormant, showing no major buying or selling activity. While this accumulation by institutional-scale players points to a solid foundation of underlying interest, it has not yet reached a critical mass capable of overriding the broader bearish macro structure.
Technical Indicators and the Long-Term Downtrend
From a technical analysis perspective, Cardano is currently locked in a bearish configuration, trading below its key long-term moving averages. The live session data puts the 50-day Exponential Moving Average (EMA) at $0.1764 and the 200-day EMA at $0.2848. Because the 50-day EMA resides far below the 200-day EMA, the technical chart exhibits a "death cross," which is a classic indicator of a prolonged long-term downtrend. Additionally, the Simple Moving Averages (SMAs) paint a similar picture, with the 50-day SMA at $0.1645 and the 200-day SMA at $0.2496.
Other momentum and volatility indicators confirm this lack of clear direction. The Relative Strength Index (RSI) is sitting precisely at 50, which is the exact midpoint of the neutral zone, proving that there is no active momentum favoring either buying or selling pressure. The Average Directional Index (ADX) has fallen to 13, a level that points to an exceptionally weak trend, indicating that ADA is stuck in a range-bound environment rather than a trending one. This is further validated by the Bollinger Bands (20,2), which range from $0.1543 to $0.1833, with the price currently hovering near the middle band of $0.1688. Meanwhile, the Stochastic oscillator shows a fast line of 50 and a signal line of 59, reflecting a balanced momentum structure. The Moving Average Convergence Divergence (MACD) line is at 0.00 compared to a signal line of -0.00, generating a mildly bullish histogram of 0.00, but it remains too weak to spark a significant rally.
Key Support and Resistance Levels to Watch
For traders looking to navigate this tight consolidation, several key technical thresholds will determine Cardano's next major move. On the downside, immediate support is established at the S1 level of $0.1668, followed closely by S2 at $0.1658. The 20-day support floor is currently identified near $0.1559, which could act as a crucial safety net. The Average True Range (ATR) of 0.01 indicates very low daily volatility, suggesting that tight stop-losses are appropriate for short-term positions.
On the upside, bulls face a series of formidable hurdles. The first obstacle lies at the pivot point of $0.1676, followed by the R1 resistance at $0.1687 and R2 at $0.1694. Beyond these immediate barriers, the 23.6% Fibonacci retracement level sits at $0.173, closely aligned with the 50-day EMA at $0.1764. A sustained daily close above this cluster of resistance is essential to open the path toward the 38.2% Fibonacci retracement level at $0.195. Furthermore, the former long-term downtrend line, which was broken earlier, now acts as a primary overhead resistance at $0.197. Only a decisive breakout above this $0.197 threshold would signal a structural trend reversal and pave the way for a test of the upper boundaries of the 52-week range.