






















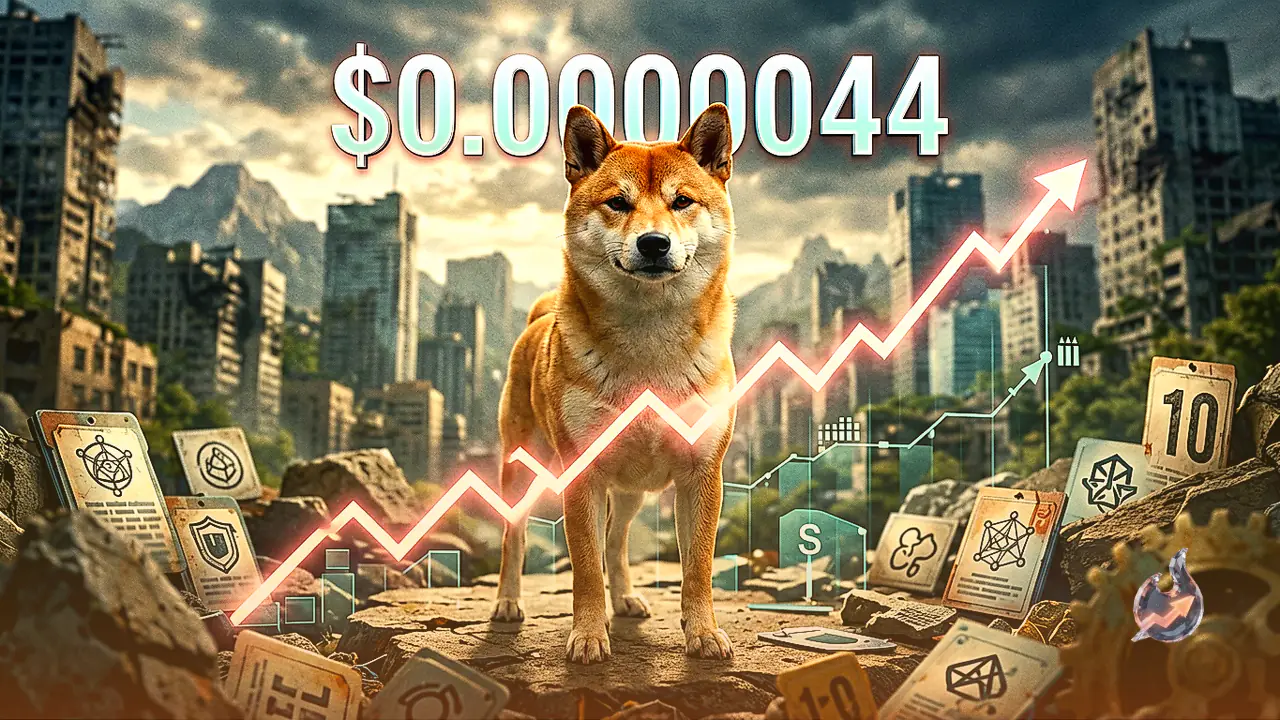

The cryptocurrency market is witnessing early signs of a stabilization attempt by Shiba Inu (SHIB), with the popular dog-themed meme coin recovering slightly to trade at $0.0000044 on Wednesday. This modest price uptick follows a successful retest of a critical daily support level at $0.0000043 on Tuesday, where buying interest re-emerged to halt further downside. Market participants are closely monitoring this key price floor, as holding above it remains essential for validating a broader technical rebound across derivative and spot crypto trading platforms.
Derivatives Market Metrics Signal Improving Trader Sentiment
Behind the recent price stabilization, derivatives data points toward a gradual shift in trader positioning. Metrics provided by CoinGlass show that the long-to-short ratio for Shiba Inu reached 1.01 on Wednesday. A long-to-short ratio above 1.0 indicates that a larger proportion of derivative traders are opening long positions, effectively placing bullish bets that the asset's price will appreciate in the near term.
Compounding this positive derivative outlook, SHIB funding rates transitioned into positive territory on Tuesday and held at 0.0087% on Wednesday. Positive funding rates imply that holders of long positions are paying funding fees to short position holders, reflecting growing willingness among buyers to pay a premium to maintain long exposure. Alongside rising social dominance metrics and an expansion in total long positions, these factors collectively highlight an encouraging backdrop for market sentiment around Shiba Inu.
Technical Oscillators Hint at Weakening Bearish Momentum
From a technical analysis perspective, Shiba Inu's price action shows signs that selling pressure may be exhausting. The Relative Strength Index (RSI) is advancing toward the neutral 50 threshold, standing at a reading of 46 on Wednesday. This upward trajectory in the RSI suggests that the strong bearish momentum that previously dominated price action is steadily losing its grip.
Similarly, the Moving Average Convergence Divergence (MACD) indicator aligns with this improving technical picture. The red histogram bars on the MACD oscillator have begun fading, providing secondary confirmation that downward momentum is diminishing. If the daily support zone at $0.0000043 continues to hold firmly, SHIB could extend its current rebound toward its 50-day Exponential Moving Average (EMA), located at $0.0000046. Conversely, a daily candlestick close beneath the $0.0000043 support level would invalidate the bullish thesis, potentially triggering a further correction down toward the key psychological level at $0.0000040.
Broader Crypto Market Context: Bitcoin, Ethereum, and XRP
Shiba Inu's recovery efforts are taking place against a backdrop of broader cryptocurrency market consolidation and geopolitical headwinds. Major digital assets experienced downward pressure on Tuesday, with Bitcoin (BTC) pulling back toward the $64,000 mark. Bitcoin had previously found support near its 50-day EMA around $64,300 on Tuesday following a 2.5% rally on the prior day. Ongoing geopolitical tensions in the Middle East have continued to weigh on global risk sentiment, creating headwinds for digital assets.
According to live financial market data, Bitcoin trades at $64,122, down 0.60% from its previous close of $64,506, with a 52-week trading range spanning from $57,748 to $97,861. Technical indicators for BTC reveal an RSI(14) reading of 52 and a MACD histogram of -8.88. Key exponential moving averages for Bitcoin include the 20-day EMA at $63,836, the 50-day EMA at $64,297, and the 200-day EMA at $72,735, reflecting an overall long-term trend structure under evaluation.
Meanwhile, Ethereum (ETH) continues to exhibit relative weakness while consolidating within a tight trading range. Ripple (XRP) remains under pressure below the critical $1.00 threshold, hovering around price levels last witnessed in 2024. XRP's underlying technical structure shows ongoing deterioration, as major moving averages slope downward, capping potential price recoveries.
Pi Network Consolidates as Core Team Updates AI Policy
In other digital asset developments, Pi Network (PI) extended its horizontal consolidation phase on Tuesday, remaining capped below the $0.0900 mark while maintaining support above $0.0839. The PI token stays under close observation as the project's Core Team prepares to implement policy changes designed to encourage genuine utility and user adoption.
Specifically, the Core Team is raising the costs associated with creating AI-powered applications within its ecosystem, a change scheduled to take effect on August 24. Industry observer and cryptocurrency specialist Manish Chhetri, who possesses over four years of experience in the digital asset sector, notes that such ecosystem parameter adjustments often aim to discourage spam while incentivizing high-quality developer participation.