
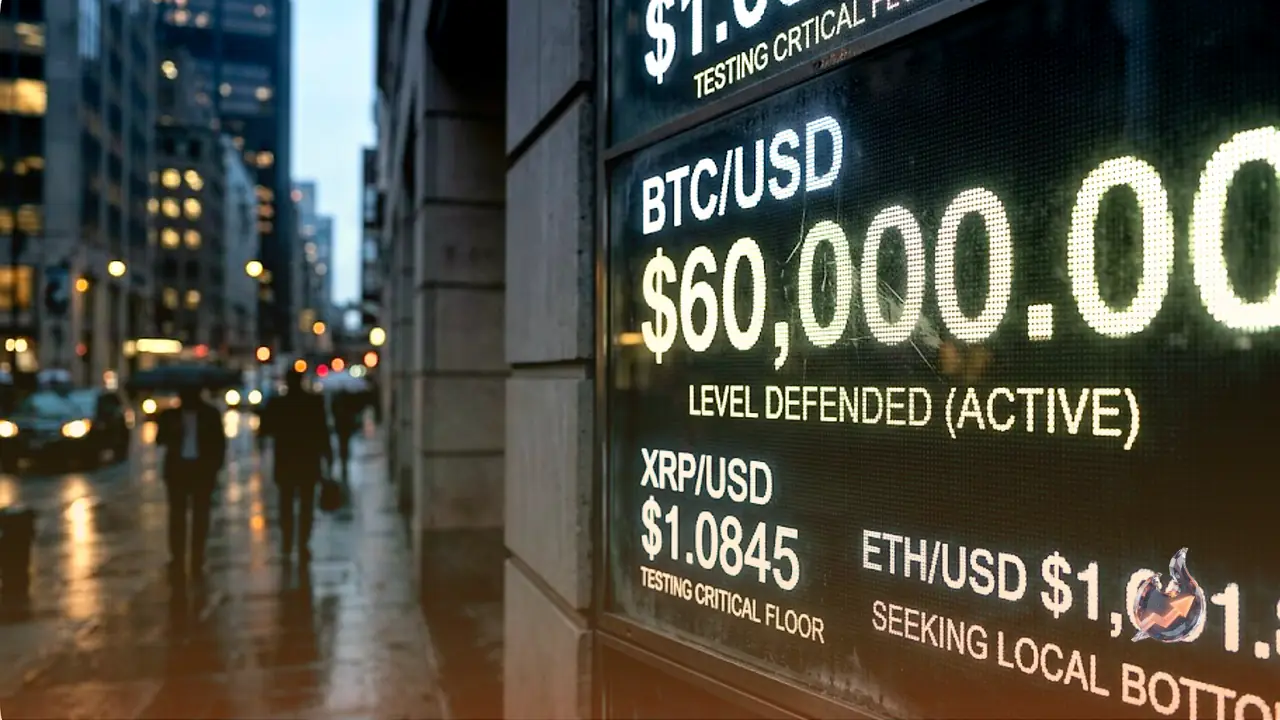

After a long stretch of relentless selling, the crypto market is finally flashing a few signs of relief. XRP may still be hovering near its lowest levels of 2026, but the technical picture suggests sellers are slowly running out of steam. At the same time, Bitcoin keeps defending the $60,000 mark and Ethereum is trying to build a local bottom. All three of the biggest digital assets are telling a similar story right now: the pressure is still there, but the panic-driven selling has lost much of its force.
XRP: A Critical Floor Gets Retested
XRP is currently trading at roughly $1.08. After yet another rejection from short-term resistance, the asset is once again testing the same support zone that stopped February's collapse and triggered a powerful rebound. That makes this one of the most important price points XRP has seen all year, because markets often return to key demand zones before staging more significant reversals.
Still, the longer-term moving averages remain tilted lower. The $1.28 area, which once acted as support, has now flipped into a meaningful resistance zone. Until those levels are reclaimed, the overall trend stays negative. But markets rarely move in a straight line for long.
What makes the current setup intriguing is the widening gap between expectations and sentiment. Since many traders now expect even more downside, even a slight improvement in conditions could spark a relief rally far stronger than anticipated. If buyers can push XRP back above $1.18 and defend the $1.05 to $1.10 support zone, attention could quickly shift to a recovery of the wider range.
Bitcoin: Holding $60,000, With a Big Move Brewing
Bitcoin is once again testing the patience of investors. Following a violent correction that dragged it from the $80,000 region toward the low $60,000s, the market remains stuck in a broad consolidation phase. Bearish pressure persisted throughout June, yet there are growing hints that a large move may be on the horizon.
According to live data, Bitcoin is currently changing hands near $60,930, down 2.77% from its previous close of $62,668. Technically, it is still below its important moving averages, including the declining 50-day and 100-day trends. The 14-day RSI sits at around 33 on live readings, pointing to weakness close to oversold territory. In the broader market structure, sellers still hold the upper hand.
But there is another side to the story. One of the chart's most significant findings is that Bitcoin has consistently protected the $60,000 to $61,000 range. After the dramatic capitulation event earlier this month, bears were unable to ignite another wave of panic selling. Instead, Bitcoin slipped into a comparatively narrow range, suggesting that selling supply may be gradually running dry.
Volume behavior backs up that interpretation. The initial collapse produced the biggest volume spikes, a classic sign of forced selling and large-scale liquidation. Live data shows current trading activity running at about 1.38 times the 20-day average, but since that initial shock, overall activity has returned closer to normal. That often happens when a market is carving out a local bottom rather than racing toward another leg lower.
As long as Bitcoin trades below those key levels, the bearish scenario stays in play. But the longer it holds above its recent lows without breaking down, the more likely it becomes that the market is quietly preparing for a sturdier comeback.
Ethereum: Searching for Stability After a Sharp Drop
After one of the biggest corrections of the year, Ethereum appears to be entering a stabilization phase. The second-largest cryptocurrency, ETH, is currently trading in the $1,650 to $1,700 range, trying to form a local bottom after a sharp sell-off pushed it below several important support levels.
Ethereum is still clearly below all of the major moving averages on the chart, which means the overall trend remains negative. The heavy damage done to market structure over the past few months is reflected in the 50-, 100-, and 200-day moving averages, all of which continue to slope downward.
Following a capitulation event, this kind of price action often shows that market participants are reassessing fair value. Volume patterns support that view. The breakdown saw the heaviest trading activity, a sign of panic selling and forced liquidations.