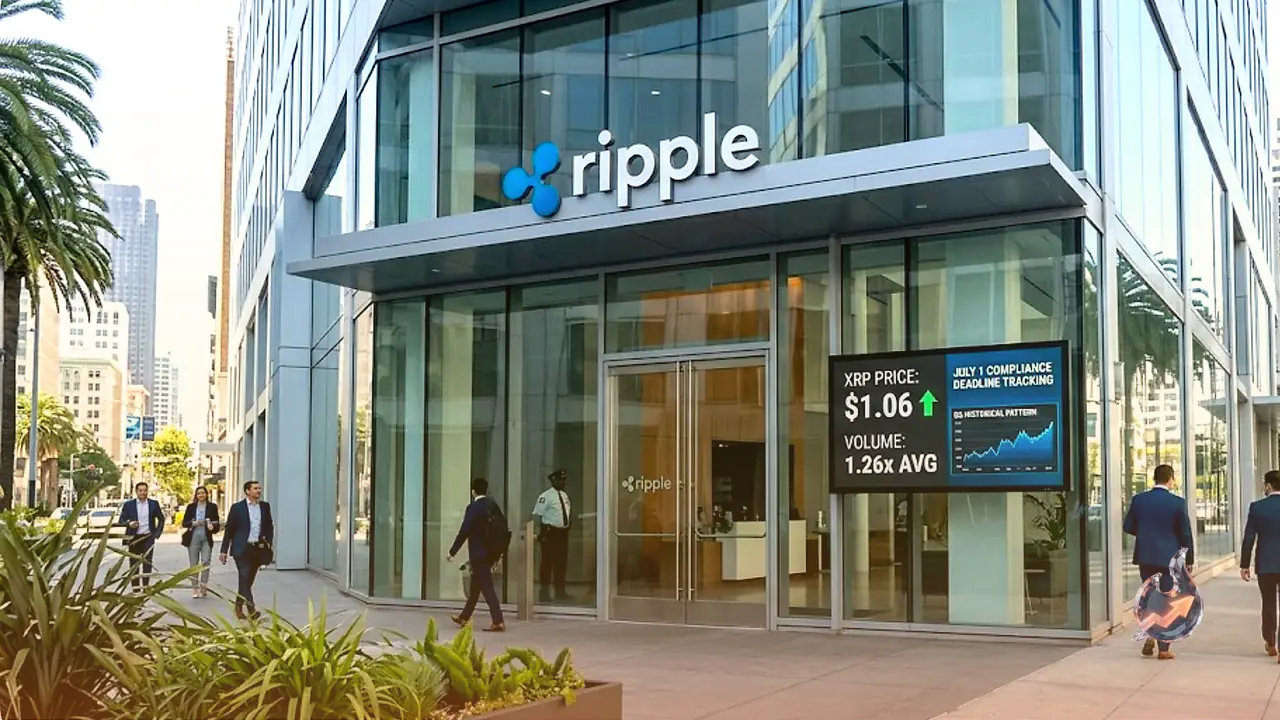

XRP is trading at $1.06, up 1.99% from its previous close of $1.04, as the third quarter of 2026 gets underway. Volume is running at 1.26 times the 20-day average, a signal that market participants are paying heightened attention at this particular juncture. The token's 52-week range spans $1.02 to $2.69, placing the current price near the lower end of that corridor.
Technical Picture: Signs That Sellers Are Running Out of Steam
The RSI(14) sits at 35 on the daily chart, edging toward oversold territory, and has formed a bullish divergence, which historically signals that bearish momentum is fading ahead of a potential reversal. The Stochastic oscillator reinforces this view, with the fast line at 17 and the signal line at 12. Williams %R at -82 and CCI at -139 further indicate that XRP is trading at a deep discount relative to its recent range.
The Money Flow Index stands at 29, reflecting capital outflows that, at this level, have often preceded price stabilization. On-Balance Volume continues to trend downward, confirming that large-scale accumulation has not yet begun in earnest.
The broader structural picture remains firmly bearish. The MACD reads -0.05 against a signal line of -0.04, leaving the histogram in negative territory. The EMA50 at $1.23 has crossed below the EMA200 at $1.58, forming a death cross that underlines the longer-term downtrend. The SuperTrend indicator also points down and would not flip bullish until XRP sustains a move above $1.19. The Ichimoku system reads strongly bearish at current levels, and an ADX of 27 confirms that the trend carries genuine momentum rather than fading drift.
Key price levels: the pivot sits at $1.06. Resistance builds at R1 ($1.07) and R2 ($1.08), with the Bollinger Band midline at $1.14 and 20-day resistance near $1.29 as further targets if buyers gain traction. On the downside, S1 is at $1.05 and S2 at $1.04, with the 20-day support base near $1.02 also aligning with the 52-week low. The ATR of $0.05 provides a practical buffer for positioning around these levels.
What Q3 History Says About XRP
For XRP, the shift from Q2 into Q3 has carried meaning that goes beyond a simple calendar change. When the token has posted two consecutive losing quarters, that paired decline has consistently marked the point of complete seller exhaustion, after which buyers have returned. The mechanism is straightforward: once every short-term seller has spent their conviction, there is no one left to drive prices further down, and buyers step in to fill the vacuum. The current market structure fits the pre-conditions that have historically preceded this kind of reset.
The July 1 Ripple Deadline
Alongside the historical pattern, there is a concrete regulatory event on the calendar. By July 1, Ripple must confirm that it is in compliance with California's Digital Financial Assets Law, specifically covering the legal operation of its custodial services and the RLUSD stablecoin. A confirmed compliance on that date would arrive at precisely the moment the technical picture shows short-term sellers having fully run out of downward momentum, while buyers are already stepping up to defend the $1 level as a key liquidity zone. The combination of a potential regulatory green light, a historically supportive seasonal setup, and deeply oversold momentum indicators makes July a month that XRP holders are watching with particular attention.