























Bullion values experienced a moderate retracement during early Asian trading on Thursday, hovering near $4,610 per troy ounce as market participants digested the latest macroeconomic prints from the United States. Following a three-day winning streak that previously pushed precious metal valuations toward peak territory around $4,700, the market has entered a consolidation phase. Investors are adjusting their portfolios in response to persistent core inflation numbers while anticipating key monetary policy signals from the upcoming Jackson Hole symposium.
US Personal Consumption Expenditures Inflation Analysis
Fresh macroeconomic statistics indicate that headline inflation measured by the Personal Consumption Expenditures price index held constant at a 3.7% annual pace in July. This figure came in slightly higher than the average market expectation of 3.6%. Meanwhile, core PCE inflation, which excludes volatile food and energy costs, held steady at 3.3% year-over-year, exactly in line with market consensus. On a monthly scale, the primary PCE index together with its core counterpart each posted an uptick of 0.2% during July.
In reaction to the inflation release, senior metals strategist Peter Grant from Zaner Metals noted that price action leading into the announcement reflected standard profit taking among traders. Grant explained that because the PCE figures aligned closely with forecasts, gold prices naturally stabilized within the previous session's trading range.
Following the data release, interest rate expectations adjusted across financial markets. Expectations measured by the CME FedWatch tool indicated nearly a 38% probability of a 25 basis points interest rate increase by the Federal Reserve at its September policy meeting, rising from 36% prior to the inflation update.
Technical Landscape and Structural Support Zones
From a technical standpoint on the daily chart, XAU/USD maintains a underlying bullish bias by holding above its 100-day simple moving average (SMA) of $4,380 and remaining above the 20-day Bollinger middle band located at $4,365. These indicator levels together form a strong demand zone that supports the broader upward trend established over recent months.
On the upper boundary, immediate technical resistance sits at the 20-day Bollinger upper band near $4,745. Corrective selling pressure may emerge at this resistance level if buying momentum stalls. Conversely, initial support on the downside is anchored by the upward-trending 100-day simple moving average near $4,380 alongside the midpoint Bollinger band at $4,365. If prices experience a deeper pullback, the bottom Bollinger envelope at $3,985.14 marks a key underlying structural floor for market participants. Momentum indicators show the 14-day Relative Strength Index (RSI) at 67.64, holding just below formal overbought territory, which indicates sustained buying interest alongside stretched short-term valuations.
Live Real-Time Market Metrics and Technical Indicators
Live financial market data shows spot gold (GC=F) trading at $4,672 per troy ounce, representing a gain of +0.72% over the prior closing price of $4,638. Trading volume is elevated at 3.41 times the 20-day average. Over the past 52 weeks, gold prices have traded within a wide band ranging from a low of $3,371 to a high of $5,586.
Live technical indicators present a strong bullish profile accompanied by stretched momentum. The 14-day RSI stands at 75, placing it within overbought territory. The Moving Average Convergence Divergence (MACD) indicator registers at 129.67 against a signal line of 96.41, creating a positive histogram of 33.26 that confirms strong directional momentum. Key exponential moving averages sit at $4,415 for the 20-day EMA, $4,322 for the 50-day EMA, and $4,337 for the 200-day EMA. Simple moving averages are positioned at $4,202 for the 50-day SMA and $4,509 for the 200-day SMA, reflecting a long-term upward trend despite a technical death cross between the 50-day and 200-day EMAs.
Bollinger bands currently span from a lower boundary of $3,984 to an upper limit of $4,753, with a central midpoint of $4,368. The Average Directional Index (ADX) reads 31, confirming an active trending market. Stochastic oscillators show a fast line at 98 and a signal line at 95, reinforcing overbought conditions. Daily volatility, measured by the Average True Range (ATR14), stands at 73.46, offering a clear parameter for risk management and stop-loss placement. Intraday levels establish a pivot point at $4,667, with resistance targets at $4,686 (R1) and $4,700 (R2), and support floor levels at $4,653 (S1) and $4,634 (S2).
Fundamental Drivers and Central Bank Reserve Dynamics
Gold has historically served a dual role in global finance as a reliable store of value and a universal medium of exchange. Beyond its traditional use in jewelry and ornament, bullion is widely recognized as a primary safe-haven asset. Investors systematically turn to precious metals during times of geopolitical conflict, financial instability, or economic downturns.
Furthermore, gold operates as an effective hedge against inflation and fiat currency devaluation because its value does not depend on any central government or sovereign issuer. Central banks represent the largest institutional holders of gold globally. Official monetary authorities hold gold reserves to diversify their balance sheets, support currency stability during crises, and enhance international confidence in their nation's financial solvency.
Data from the World Gold Council highlights that monetary authorities accumulated 1,136 tonnes of bullion valued at roughly $70 billion within official holdings throughout 2022. This volume represents the largest single-year net purchase since formal record-keeping began. Emerging market central banks, particularly those in China, India, and Turkey, have consistently led this accumulation trend by increasing their gold reserves at an accelerated pace.
Macroeconomic Correlations and Yield Interplay
Precious metal prices maintain a established inverse correlation with both the US Dollar (USD) and US Treasury yields. Because gold is priced globally in US dollars (XAU/USD) and pays no yield, a declining dollar makes gold more affordable for international buyers, stimulating demand. Conversely, when US Treasury yields rise, non-yielding bullion faces heightened competition from fixed-income assets offering attractive yields.
Gold also exhibits an inverse relationship with equities and risk assets. Robust stock market rallies often draw investor capital away from safe havens into risk assets, exerting downward pressure on metal prices. In contrast, widespread equity market sell-offs typically spur capital flows into safe-haven bullion. Broad economic factors such as geopolitical tension or recession threats can rapidly escalate gold prices, whereas rising borrowing costs tend to constrain upward price movement.
Foreign Exchange Movements: Cable and Fiber Trajectories
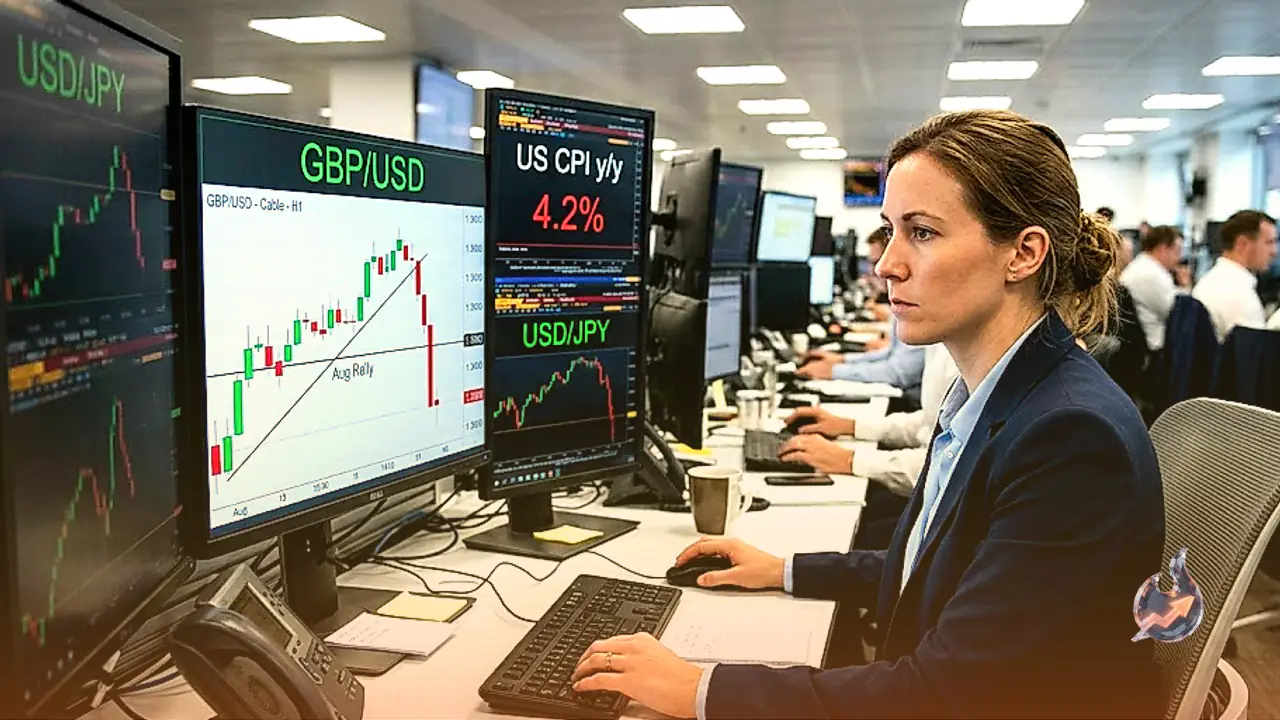
In currency markets, the British Pound (GBP/USD), commonly referred to as Cable, resumed its downward trajectory by falling below the 1.3600 level on Wednesday. This move erased the bullish attempt seen during Tuesday's session as the US Dollar rallied broadly. Foreign exchange market dynamics were driven by investors assessing fresh US economic data alongside broader international geopolitical developments.
Similarly, the Euro (EUR/USD), known in trading circles as Fiber, faced renewed selling pressure, sliding back to the mid-1.1600 region prior to the Asian market open. The currency pair lost upside momentum as the US Dollar posted gains across the board. Market caution remained high ahead of major economic releases and upcoming public commentary, while market participants also prepared for the European Central Bank (ECB) to publish its latest meeting Accounts on Thursday.
Corporate Catalyst: Nvidia Earnings Expectations
Beyond macroeconomic releases, financial markets are closely watching major corporate earnings. Semiconductor giant Nvidia, a key driver in the artificial intelligence sector, is set to publish its quarterly financial results on Wednesday evening following the close of US equity markets.
Wall Street consensus forecasts anticipate another extraordinary financial performance from Nvidia. Analysts project quarterly revenues could surpass $92 billion, with earnings per share (EPS) expected around $2.09. Given Nvidia's substantial market capitalization and influence over equity market sentiment, these results could significantly impact investor risk appetite, creating ripple effects across equity and commodity markets alike.
Federal Reserve Policy Outlook and Jackson Hole Speech
Monetary policy expectations remain centered on Federal Reserve leadership as Fed Chair Kevin Warsh prepares to deliver his inaugural address at the Jackson Hole Symposium on Friday. This speech represents Chair Warsh's first major policy address at the annual economic conference.
Investor expectations extend beyond immediate policy moves, such as whether interest rates will be adjusted or held steady at the upcoming September FOMC meeting. Market participants are looking for broad strategic signals regarding economic growth, inflation targeting, and future rate trajectory. Because gold is a non-yielding asset, monetary policy decisions that lower interest rates generally enhance gold's investment appeal, while higher rate environments create headwinds for the metal.