
























Market participants trading XRP are demonstrating solid dominance over price action as the remittance-oriented digital asset approaches a pivotal breakout attempt above the $1.60 threshold. Changing hands around $1.57, the token has secured an impressive 13 percent advance over the course of the week. Sustained accumulation by large-scale cryptocurrency investors and significant institutional demand through exchange-traded products have combined to create an optimistic backdrop, prompting market watchers to evaluate critical resistance hurdles and broader upward targets.
Large Holders Expand Exposure as Whale Supply Share Climbs
Data tracking wallet balances reveals that high-net-worth investors have been actively expanding their risk exposure over recent months. Large-scale holders managing between 100 million and 1 billion tokens initiated an aggressive accumulation strategy in late July. Metrics compiled by Santiment show that this tier controlled nearly 11 percent of the entire circulating supply on August 1, a metric that rose to 12 percent by September 1 and currently stands at approximately 14 percent. Such persistent absorption of coins from the open market highlights deep confidence among deep-pocketed market participants.
A parallel trend is visible among addresses holding between 10 million and 100 million tokens. This cohort has maintained a steady and disciplined accumulation pattern, now commanding 18 percent of the aggregate token supply. Continued token absorption across these two prominent tiers bolsters the short-term constructive trajectory, materially improving the probability that price will not only establish a definitive close above $1.60 but potentially extend its upward trajectory toward levels exceeding $2.00.
Institutional Demand Signals Expansion Through $20 Million ETF Daily Inflow
Reinforcing the on-chain accumulation patterns, institutional capital channels have recorded renewed activity. Spot Exchange-Traded Funds (ETFs) dedicated to the token captured a notable $20 million in net daily inflows on Tuesday. This turnaround follows a subdued session at the start of the week and an outflow of $44,000 on the preceding Friday. The latest injection lifted aggregate cumulative inflows to $1.73 billion, matching the current average net asset valuation across the fund complex at $1.73 billion.
Exchange-traded vehicles function as pooled investment structures tracking the market price of an underlying asset or index, enabling mainstream capital to secure market exposure without navigating direct custody. The regulatory path for such products developed over several years; the US Securities and Exchange Commission approved the first Bitcoin futures ETF in October 2021, eventually clearing seven futures funds while leaving over twenty proposals on hold due to market manipulation concerns. The regulatory posture shifted dramatically in January 2024 with the formal approval of spot Bitcoin ETFs, an event widely regarded as a major breakthrough for digital asset integration into mainstream finance. These structures reduce direct custody risks and operational hurdles for traditional investors, even as they introduce management fees and reflect underlying market volatility without conferring direct token possession.
Technical Indicators and Structural Levels Define the Bullish Outlook
From a charting perspective, XRP maintains a constructive technical structure by trading comfortably above its 50-day, 100-day, and 200-day Exponential Moving Averages (EMAs). The 200-day EMA, positioned at $1.36, serves as a dependable dynamic base that reinforces the broader upward trend. Supporting momentum indicators also align with buyer dominance: the Relative Strength Index (RSI) fluctuates near 68, approaching overbought parameters, while the Moving Average Convergence Divergence (MACD) remains positioned in positive territory with an active buy signal. While these readings underscore firm bullish momentum, they also highlight the possibility of temporary consolidation or minor pullbacks.
On higher timeframe charts, the digital currency continues to preserve its position above the 50-week EMA at $1.52 and the 200-week EMA at $1.37. Furthermore, the asset has established footing above a prior descending trendline resistance, which now serves as technical support around $1.52. Overhead, the immediate hurdle is anchored at the 100-week EMA near $1.59. Securing a weekly candlestick close above this barrier would confirm structural strength and open the path toward more ambitious price extensions.
In the event of a market retracement triggered by short-term profit taking, dynamic support zones are clearly defined. Initial demand is concentrated around the former trendline break at $1.52, reinforced by the 50-week EMA at the same valuation. Beneath this zone, the 200-day EMA at $1.36 offers a primary defensive cushion, supported by the SuperTrend line at $1.34 and the 50-day EMA at $1.33. Should deeper corrections unfold, the 100-day EMA at $1.28 and the 200-week EMA at $1.37 represent critical structural floors that bulls must defend to keep the overarching macro uptrend intact.
Broader Cryptocurrency Momentum Bolsters Altcoin Strength
The strength exhibited by XRP mirrors broader stability across the digital asset landscape. Top-tier tokens have entered a period of mid-week consolidation after notable gains, with Bitcoin stabilizing at $86,300 following a 6 percent weekly climb and Ethereum trading near $2,751 after a 4 percent advance over the same period. Ethereum previously extended its rolling seven-day gain to 14 percent after finding support from easing energy prices and lower US 10-year Treasury yields.
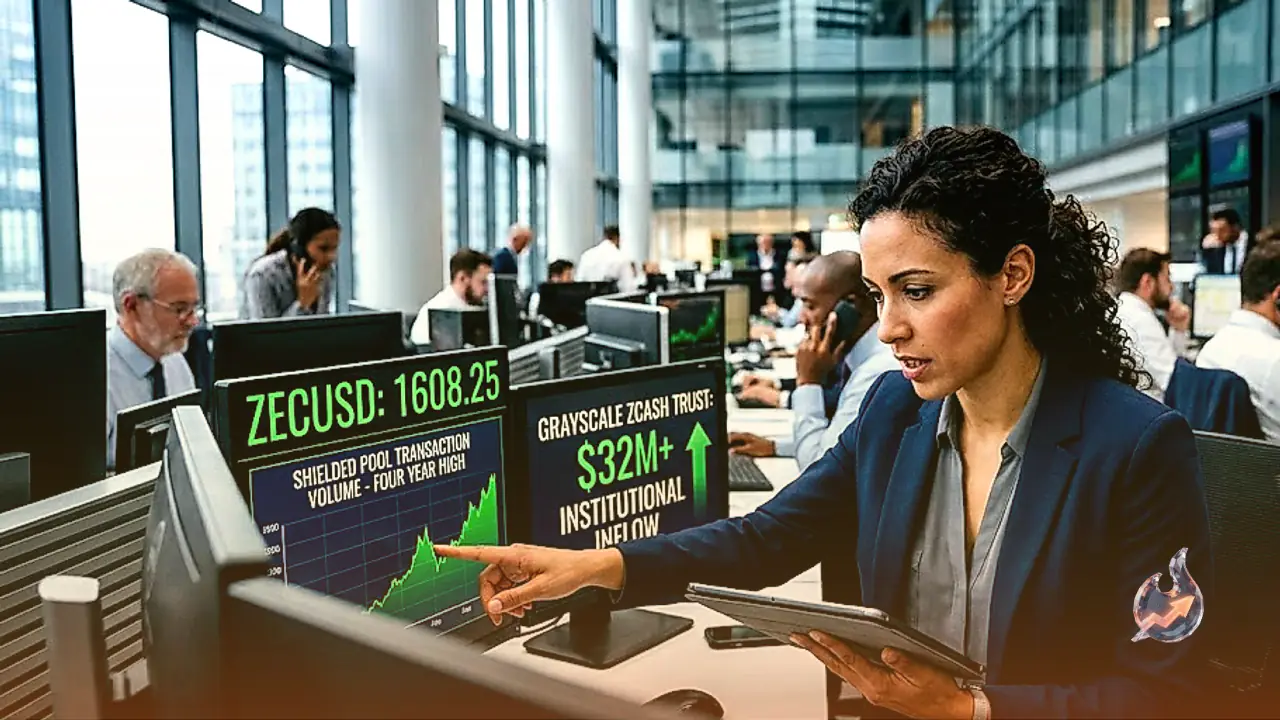
Performance among alternative assets has been equally pronounced. Zcash advanced past $1,600 on Wednesday following a 10 percent jump the prior day, supported by weekly shielded transaction volume reaching its highest level since 2022 and over $30 million in Tuesday inflows into Grayscale's ZEC fund. Meanwhile, tokens like Bitcoin Cash, BitcoinSV, and LayerZero recorded double-digit daily advances. Bitcoin Cash reclaimed the $300 threshold to touch a three-month peak, while BitcoinSV and LayerZero achieved annual and four-month peaks, respectively. Against this supportive backdrop, a confirmed daily settlement above $1.60 could serve as the catalyst for XRP to initiate its next major leg higher.