




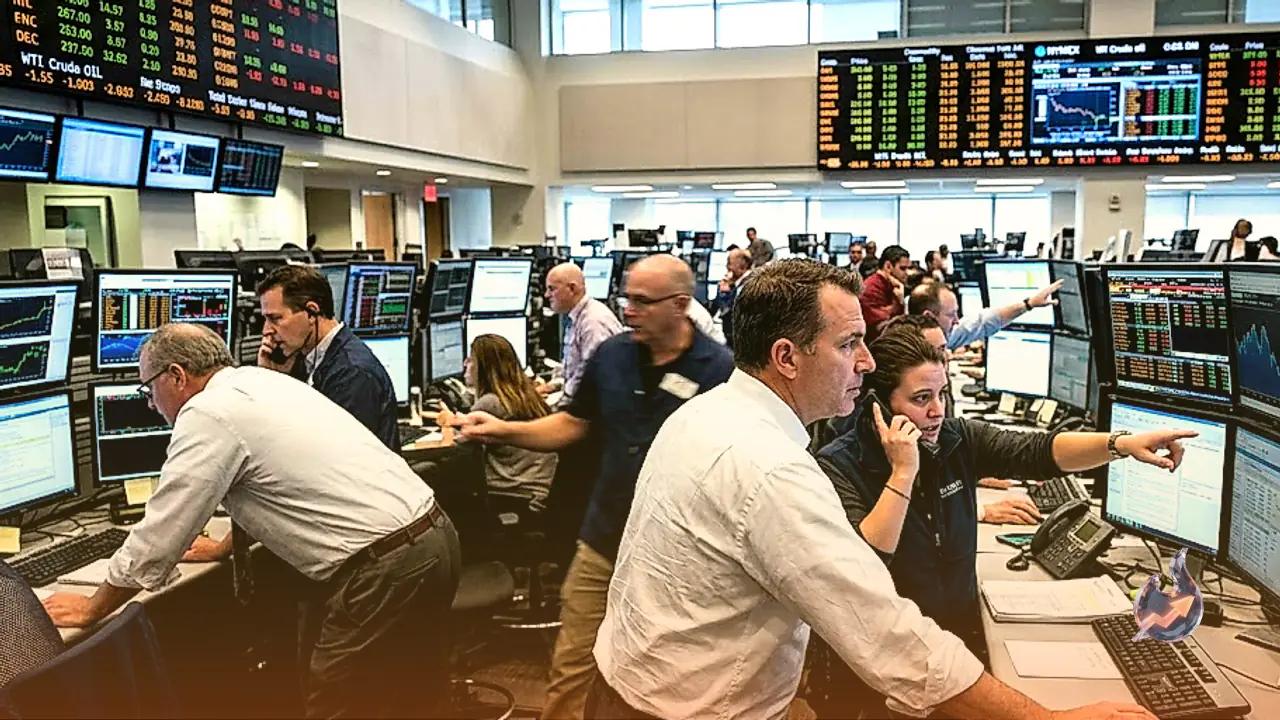




















Crude oil benchmarks retreated from multi-week highs as rapid shifts in geopolitical rhetoric and incoming supply news tempered a sharp rally. Brent crude had climbed past USD 105 per barrel to mark its strongest price point in nearly a month, following an aggressive upward surge that briefly touched USD 106 on the previous trading day. However, momentum halted abruptly as trading pushed prices back down into the USD 102 to USD 103 per barrel corridor, offering immediate relief to global commodity markets that had been pricing in severe disruption risks.
Geopolitical Clarification and Chinese Fuel Shipments
The sudden reversal in crude oil prices was primarily prompted by comments from the political sphere regarding Middle Eastern tensions. President Trump stated that the United States would not launch an attack against Iran ahead of the midterm elections. That declaration swiftly took the edge off supply-disruption premiums that had accumulated across energy contracts. Market sentiment found further stability on indications that China is preparing to restart its outbound shipments of refined fuel in October. The prospect of renewed fuel flow from Chinese refineries provided an additional buffer, helping the broader fuel market cool down and pulling Brent down near USD 103 per barrel overnight.
Strait of Hormuz Bottlenecks and Hurricane Warnings
The price spike preceding this pullback had been driven by acute logistical and environmental threats. Severe maritime security concerns erupted in the Middle East following last week's record volume of attacks targeting commercial oil tankers, leading to a dramatic drop in vessel movements across the critical Strait of Hormuz chokepoint. Compounding these transport worries, energy operators monitored the trajectory of Hurricane Isaias as it moved toward the US Gulf Coast, stoking fears that domestic extraction and refining facilities might suffer operational downtime. The combination of stalled shipping lanes in the Persian Gulf and storm-related production hazards in North America had catapulted Brent past USD 105 per barrel before political developments softened the trajectory.
FX Markets and Bullion Performance
Beyond the petroleum sector, broad financial markets responded to shifting macroeconomic pressures. The US Dollar remained below an 18-month high as a pullback in US Treasury yields weighed on the greenback, even as markets balanced geopolitical uncertainty with monetary policy expectations. Taking advantage of the softer dollar, the Australian Dollar (AUD/USD) built upon its bounce from weekly lows and pressed toward the 0.7000 mark during Asian trading hours on Friday, buoyed by hawkish policy expectations surrounding the Reserve Bank of Australia. Concurrently, USD/JPY held steady near 158.00; the Japanese Yen struggled after official economic metrics revealed that Japan's household expenditure contracted for the ninth consecutive month. In metals, Gold demonstrated resilience, climbing back toward $4,200 on Friday as it sustained its rebound from two-month lows, although its daily RSI still reflects bearish momentum as investors monitor forthcoming sentiment releases.
Crude Technical Landscape and Market Indicators
Evaluating current futures pricing from the latest session, Crude Oil (CL=F) stood at $90.43, down 1.16 percent from the prior close of $91.49. Over the past 52 weeks, the commodity has traversed a wide price span between $54.98 and $119.48, while daily trading volume printed at 0.09 times its 20-day average. From a technical vantage point, the 14-day RSI sits at 47. The MACD reading stands at -0.39 against a signal line of 0.43, leaving the histogram at -0.82 in bearish territory. In terms of trend averages, the 20-day EMA resides at $91.89, the 50-day EMA is at $90.14, and the 200-day EMA is positioned at $81.20, alongside a 50-day SMA of $89.17 and a 200-day SMA of $83.22. The structural posture maintains an ongoing long-term uptrend characterized by a golden cross between the 50-day and 200-day exponential moving averages. Bollinger Bands over a 20-period horizon frame boundaries at $84.20 and $104.49 around a middle line of $94.34, with current prices holding comfortably inside the envelope. The ADX reading of 18 denotes range-bound conditions, while the Stochastic fast and signal lines mark 34 and 25 respectively. Volatility metrics show a 14-day ATR of 4.19, defining a dynamic stop-loss reference. Critical transactional thresholds place the central pivot at $90.68, resistance levels at $91.16 (R1) and $91.90 (R2), and immediate supports at $89.94 (S1) and $89.46 (S2), framed by broader 20-day support at roughly $86.86 and overhead resistance at $106.75.