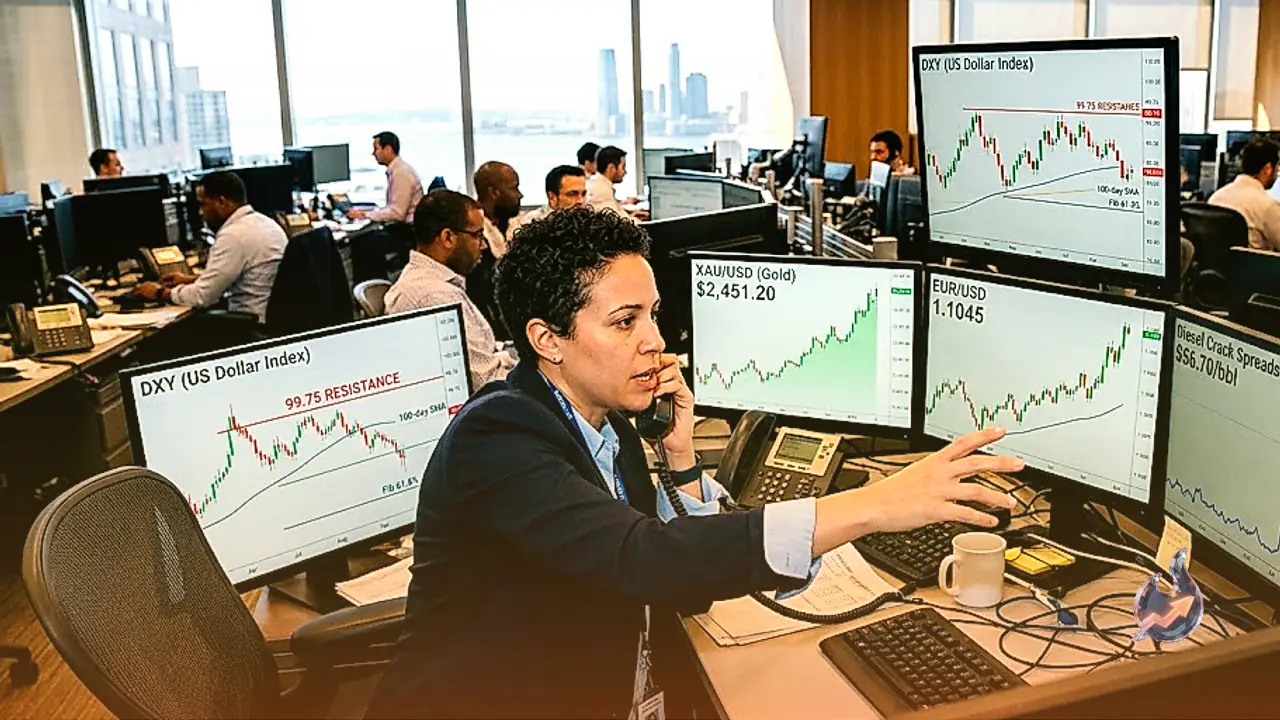
























Gold has managed to find some stability following a decline that pushed it to its lowest level since August 19. The non-yielding metal continues to face its primary hurdle in the form of higher-for-longer interest rate expectations. Analysts note that XAU/USD needs to reclaim key technical levels to effectively ease the lingering bearish pressure currently dominating the market sentiment.
The precious metal experienced a sharp decline of roughly 3.20% on Friday, triggered by Federal Reserve Chair Kevin Warsh's speech at the Jackson Hole Symposium. Market participants interpreted Warsh's commentary as notably hawkish, reviving expectations that the central bank could implement an interest rate hike as early as September. This shift pushed the US Dollar and short-term US Treasury yields significantly higher across the board.
Rabobank Analysis and Inflation Outlook
Analysts at Rabobank pointed out that Warsh made it abundantly clear that he remains open to further interest rate increases unless underlying inflation begins to improve convincingly. They underscored that policymakers must be thoroughly convinced that underlying inflation is moving toward the official target clearly and at a sufficient pace; otherwise, additional policy tightening work remains necessary.
According to data from the CME FedWatch tool, markets are currently pricing in approximately a 61% probability of a September rate hike, rising sharply from roughly 38% prior to Warsh's address. An environment characterized by elevated interest rates diminishes the appeal of Gold, as the precious metal does not offer any yield or regular interest income to investors.
Middle East Tensions and Oil Market Influence
Concurrently, surging oil prices driven by intensifying geopolitical tensions in the Middle East continue to introduce upside risks to inflation forecasts. Iran reported that it targeted US bases in Jordan and US military installations at Al Minhad Air Base in the United Arab Emirates in retaliation for US forces bombing two rocket launchers on Iran's Larak Island, though the UAE has denied that Al Minhad Air Base was struck. West Texas Intermediate oil prices climbed roughly 3.5% on Monday, trading near $85.60 per barrel.
From a technical standpoint, XAU/USD maintains a slightly bearish near-term bias following the latest downward leg, with the metal slipping back below the 200-day Simple Moving Average situated at $4,529. The Relative Strength Index on the daily chart has retreated from overbought conditions to around 55, pointing toward fading bullish momentum. Additionally, the Moving Average Convergence Divergence has drifted marginally below its signal line, reinforcing signs of weakening upside pressure.
Key Support and Resistance Levels
On the downside, initial technical support is positioned at the 100-day SMA near $4,370, followed by the 50-day SMA at $4,211. A sustained breakdown beneath these thresholds could expose the horizontal price floor near $4,000. Conversely, immediate resistance is found at the 200-day SMA at $4,529, followed by the formidable horizontal barrier located at $4,700.
Gold has maintained a critical role throughout human history, widely utilized as a store of value and an established medium of exchange. Aside from its aesthetic appeal and use in jewelry, the precious metal is universally regarded as a safe-haven asset, making it a favored investment vehicle during periods of economic turbulence. It also functions as a reliable hedge against inflation and currency depreciation because it is not tied to any specific government issuer.
Central banks represent the largest institutional holders of Gold. In their ongoing efforts to fortify their respective currencies during volatile times, central banks frequently diversify their reserves by acquiring bullion to enhance perceived economic and currency solvency. Data compiled by the World Gold Council indicates that central banks added 1,136 tonnes of gold valued at approximately $70 billion to their reserves in 2022, marking the highest annual purchase on record, led heavily by emerging economies such as China, India, and Turkey.
Correlations and Market Drivers
Gold exhibits a well-documented inverse correlation with the US Dollar and US Treasuries, both of which serve as major global reserve and safe-haven assets. When the greenback depreciates, Gold tends to appreciate, enabling investors and institutions to diversify effectively. Furthermore, gold prices typically move inversely to risk assets, meaning stock market rallies tend to weigh on bullion prices, while broader financial market sell-offs benefit the precious metal.
Price movements are governed by a diverse array of catalysts, including geopolitical instability and recession fears that escalate safe-haven demand. As a yield-free asset, lower interest rates favor gold, whereas elevated borrowing costs usually constrain the yellow metal. Ultimately, broader trajectories depend heavily on USD behavior, given that the asset is priced in US dollars.
Broader Forex and Commodity Movements
In broader currency markets, the GBP/USD pair has rebounded toward 1.3550 at the start of the new trading week, recovering a portion of Friday's heavy losses from a more than one-week trough, supported by renewed dollar softness despite looming US-Iran geopolitical risks. Meanwhile, the EUR/USD pair strengthened toward 1.1600 during European trading hours as traders awaited preliminary German inflation data.
In the digital asset space, Dogecoin traded near key support around $0.081 following a more than 12% decline over the prior week, with on-chain metrics indicating profit-taking among larger wallet holders. Simultaneously, the US diesel crack spread surged above $100 per barrel for the first time, reaching an intraday record high of just over $102.00, signaling continued strength in refined product markets.