























Gold Prices Face Continued Pressure Near 2026 LowsMarket
24 Jun 2026, 11:02 pm (45 days ago)· 2

Gold Prices Face Continued Pressure Near 2026 Lows

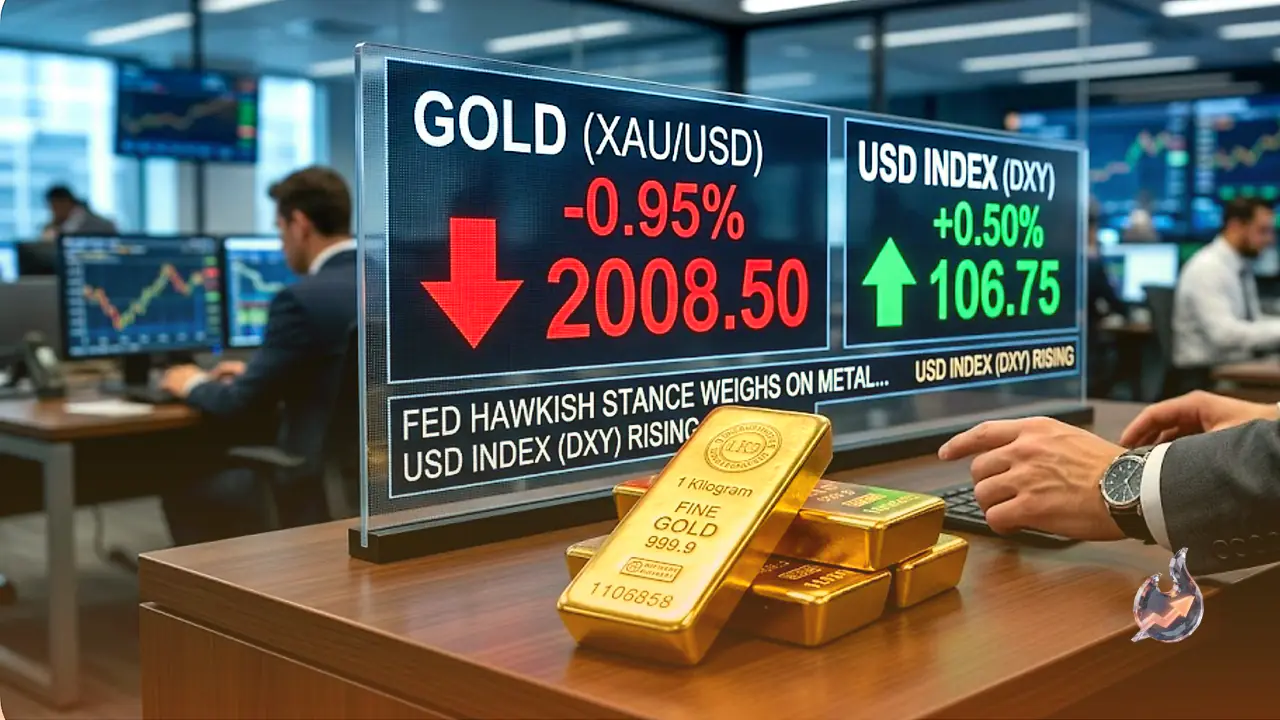
Gold prices are hovering near their lowest levels since late 2025 as a strengthening US Dollar and hawkish Federal Reserve expectations weigh on the metal.

GCSMA20 SMA50 · RSI · MACD
Candles + SMA20/50 · RSI(14) · MACD(12,26,9) with buy/sell signals — live from Yahoo

Technical Analysis24 Jun 2026

Moving AveragesEMA 20 / 50 / 200

What it is

Exponential Moving Averages smooth price to reveal the trend over the short (20), medium (50) and long (200) term. Price above them and stacked upward is an uptrend; below them and stacked down is a downtrend.

Where it stands now

GC trades at $4,025 versus EMA20 $4,298, EMA50 $4,461, EMA200 $4,287.

Possible move ahead

Rallies likely stall near EMA20 ($4,298).

RSIRelative Strength Index (14)

What it is

RSI is a 0–100 momentum gauge of recent gains versus losses. Above 70 is overbought (stretched), below 30 oversold (beaten down), and 50 is the neutral line.

Where it stands now

GC's RSI is 31.

Possible move ahead

Watch a push above 60 or a slide under 40.

Gold prices continue to face significant downward pressure, gyrating around the key 4,000 dollar per troy ounce mark. This represents the lowest level for the yellow metal since November 2025. A combination of macroeconomic uncertainty and a firmer US Dollar has eroded appetite for safe-haven assets.

Economic Drivers and Market Sentiment

The US Dollar has seen some recovery as geopolitical tensions in the Middle East have eased, with traffic through the Strait of Hormuz remaining steady. Market focus has now shifted to the US Personal Consumption Expenditures (PCE) Price Index, set for release on Thursday. Annual inflation is projected to rise to 4.1 percent from April's 3.8 percent. A higher-than-expected reading would likely increase the likelihood of interest rate hikes by the Federal Reserve, providing further tailwinds for the USD.

Also read

Technical Outlook

On the four-hour chart, the metal remains decidedly below the 20-period Simple Moving Average (SMA) of 4,124.98 dollars, the 100-period SMA at 4,268.32 dollars, and the 200-period SMA at 4,413.03 dollars. Momentum readings are firmly negative, while the Relative Strength Index (RSI) hovers near the 30 line without showing signs of exhaustion. The daily chart also reflects a bearish trend, with the metal trading well below the 20-day SMA at 4,296 dollars and the 200-day SMA at 4,473 dollars.

Key Price Levels

Initial resistance on the upside is situated at 4,124.98 dollars. A sustained break above this could expose the next barrier near 4,268.32 dollars. Support remains immediate ahead of the 3,900 dollar mark. As of the June 24, 2026, session, gold is trading at 4,025 dollars, down 2.54 percent from the previous close of 4,130 dollars.


Questions & Answers

What is the current trading price of gold?
Gold is currently trading at 4,025 dollars per troy ounce based on the latest market data.
What is the main reason for the decline in gold prices?
The strengthening of the US Dollar and hawkish interest rate expectations from the Federal Reserve are the primary factors weighing on gold prices.
What is the next key resistance level?
The initial resistance level for gold is located near 4,124.98 dollars.
Has the decline in gold prices reached a bottom?
Technical indicators suggest persistent downside pressure, with 3,900 dollars serving as the immediate support level.

Comments 0

No comments yet — be the first.

Citizen journalism

Become a TrendKia journalist

Voice of the people

Share news, photos and videos from your area with TrendKia and let your voice reach the nation. Every citizen a journalist.

Join now
CH 01 LIVE
TrendKia TV ON AIR