























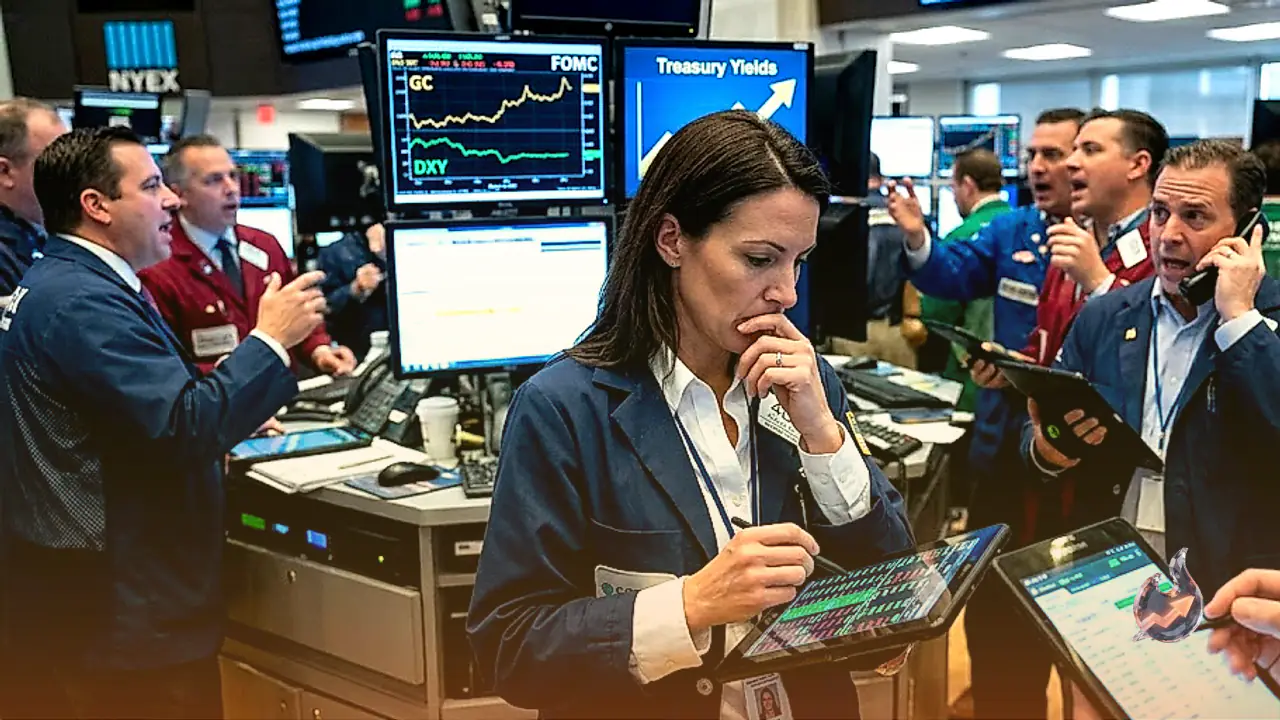

Gold staged a measured recovery during Wednesday's trading session, shaking off an earlier retreat seen during Asian market hours as aggressive buying in the US Dollar momentarily paused. Market participants, however, remain deeply hesitant to push bullion significantly higher, keeping precious metal prices locked in a tight holding pattern ahead of the pivotal Federal Reserve interest rate decision scheduled for release later in the day.
Energy-Driven Inflation and Soaring Treasury Yields Cap Bullion Upside
The primary headwinds restricting any durable rally in the bullion market stem from resilient inflation concerns tied to escalating energy costs. Crude oil surged to a fresh peak on Tuesday, marking its highest price point since May 20. Supply disruption fears originating from the Middle East have reignited worries that persistent energy costs will complicate the disinflation process. This sticky price backdrop has bolstered expectations that the Federal Reserve will maintain a stringent monetary stance and potentially pursue further borrowing cost increases.
Simultaneously, a massive expansion in government and corporate debt issuance triggered a broad selloff across sovereign debt instruments worldwide. This persistent fixed-income disposal propelled the benchmark 10-year US Treasury bond yield past the critical 5% threshold for the first time since 2023, reaching its highest level observed since 2007. Elevated yields on risk-free sovereign debt fundamentally diminish the appeal of holding non-yielding precious metals, while reinforcing the greenback's status as the world's premier safe-haven store of value.
Escalating Middle East Hostilities and Maritime Blockades
Geopolitical turbulence across the Middle East has added another layer of complexity to asset pricing. Following a week of sustained drone and missile strikes executed by Iran-aligned Houthi forces based in Yemen, Saudi Arabia initiated widespread domestic security alerts covering multiple territories, including Mecca and the commercial hub of Jeddah. The Saudi-led military coalition subsequently pledged to deliver a firm response to the aggression, heightening the imminent risk of an expansive regional war.
Further intensifying maritime friction, the United States Central Command disclosed that it has intercepted and redirected 103 commercial vessels as part of an enforcement blockade against Iranian maritime commerce through the vital Strait of Hormuz. While geopolitical confrontations traditionally fuel safe-haven bullion purchases, the prevailing dynamic has simultaneously funneled liquidity directly into the US Dollar. Consequently, the foreign exchange strength of the greenback continues to counteract gold's traditional safe-haven bid, restricting upward price discovery.
Technical Indicators Point to Fading Momentum Near Moving Averages
From a chartist perspective, gold has displayed intermittent stability beneath its 50-day Simple Moving Average while maintaining a fragile position just above the 50% retracement boundary of its July-August advance. Despite holding these zones, underlying momentum readings have notably deteriorated. The Moving Average Convergence Divergence indicator remains pinned in negative territory, while the Relative Strength Index is languishing just beneath the neutral 50 threshold, signaling that buying enthusiasm is tapering off.
Live market metrics reflect spot gold trading at $4,425 per ounce, recovering 0.57% from its prior session close of $4,400, inside an extensive 52-week operating boundary spanning $3,664 to $5,586. Daily trading volume registered at 0.90 times the 20-day historical average. Technical parameters highlight an RSI(14) at 50, alongside an MACD reading of -1.38 against a signal line of 19.46, generating a bearish histogram of -20.83. Moving average alignments show the 50-day EMA at $4,393 positioned below the 200-day EMA at $4,426, confirming a death-cross formation within a broader downtrend. Immediate structural pivot points position resistance at $4,452 and $4,480, against downside support cushions at $4,385 and $4,345.
Federal Reserve Mandates and Monetary Transmission Mechanisms
Monetary governance in the United States is anchored by the Federal Reserve, which operates under a dual mandate established by Congress: preserving price stability and fostering conditions for maximum sustainable employment. The central bank executes this strategy primarily through alterations to the target federal funds rate, which dictates baseline borrowing costs throughout the banking architecture.
When macroeconomic inflation accelerates beyond the established 2% benchmark, policymakers respond by elevating interest rates, thereby increasing debt servicing burdens for corporations and consumers alike. This contractionary measure tends to strengthen the US Dollar by amplifying nominal yield differentials, rendering American financial markets more attractive for international capital allocation. Conversely, when headline inflation slips beneath target thresholds or labor market deterioration accelerates, the central bank implements policy easing to stimulate credit formation, which tends to depreciate the currency.
FOMC Governance and Deliberative Procedures
The Federal Reserve convenes eight designated monetary policy sessions per calendar year, during which the Federal Open Market Committee conducts exhaustive assessments of economic performance before determining official rate trajectories. The voting body of the FOMC consists of twelve officials who wield formal authority over national monetary conditions.
This roster comprises the seven appointed members of the Federal Reserve Board of Governors, the president of the Federal Reserve Bank of New York as a permanent voting vice-chair, and four rotating regional reserve bank presidents drawn from the remaining eleven districts, who serve one-year terms. The guidance and policy trajectories determined during these assemblies exercise immense influence over international capital flows, commodity valuations, and borrowing benchmarks.
Mechanics of Quantitative Easing and Quantitative Tightening
Under extraordinary economic stress, the Federal Reserve can deploy non-standard monetary interventions, primarily Quantitative Easing. This mechanism involves substantial balance sheet expansion designed to inject liquidity directly into frozen credit channels when conventional interest rate tools reach the zero lower bound. Historically utilized during the 2008 Great Financial Crisis, Quantitative Easing entails newly generated central bank reserves being deployed to purchase large quantities of high-grade debt from financial institutions, a process that typically depresses the foreign exchange value of the domestic currency.
Conversely, Quantitative Tightening represents the deliberate unwinding of this stimulus footprint. Under this framework, the central bank ceases passive reinvestment of maturing bond principal and stops buying debt from commercial banks. By allowing the asset portfolio to contract, liquidity is withdrawn from the wider financial ecosystem, a dynamic that historically provides structural support to the US Dollar by constraining excess currency supply.
Cross-Asset Movements in Foreign Exchange and Digital Markets
The greenback's broader strength reverberated across international currency desks. The Australian Dollar fell for a third consecutive trading session, clinging to the 0.7100 support level near monthly lows as the risk-sensitive currency struggled against aggressive interest rate bets and energy price pressures. Meanwhile, the US Dollar advanced against the Japanese Yen, pushing the currency cross past 155.00 to mark a fresh weekly high, though gains halted below mid-155 levels as investors awaited policy declarations from both the Federal Reserve and the Bank of Japan.
Japan's prolonged era of ultra-low interest rates provided cheap borrowing that financed trillions of dollars in worldwide investments over the past decade. With the Bank of Japan poised to deliberate on further policy tightening, that historic funding channel is confronting structural transformation. In Europe, the UK Office for National Statistics prepared to release August Consumer Price Index data, setting the stage for significant volatility in the British Pound ahead of the Bank of England's rate verdict. Concurrently, cryptocurrency markets saw Ethereum slide to $2,400 following procedural stagnation of the Clarity Act in the US Senate, though persistent capital inflows continue to be absorbed by spot buyers. For gold, the definitive catalyst for directional breakout remains the impending policy communication from the FOMC.