





















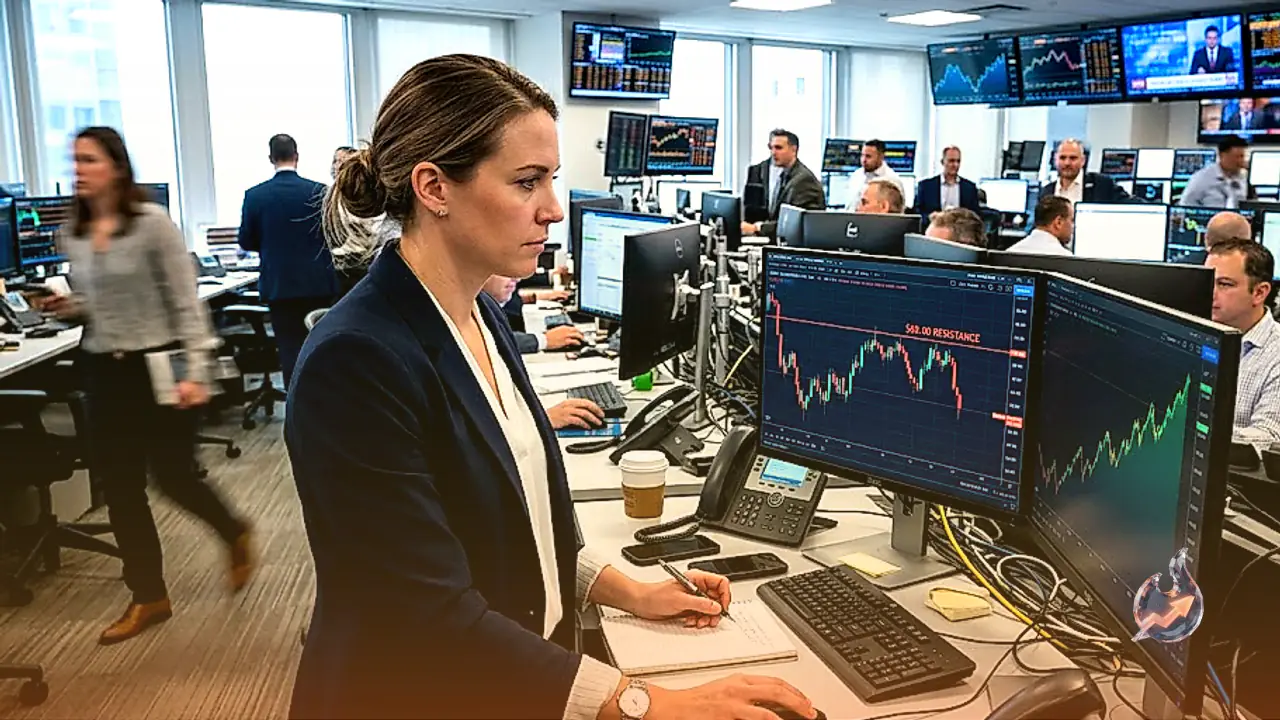

Silver has encountered renewed headwinds in international markets, turning lower ahead of the $68.00 hurdle and dipping below $66.50. The commodity remains constrained by a firm US Dollar and adjusted interest rate expectations following the Federal Reserve's hawkish stance. While the broader underlying trend has not broken down, short-term indicators highlight weakening upward momentum. The asset currently trades around $66.24 per ounce with an overarching neutral bias, keeping price action largely confined between the $62.00 floor and the $68.00 ceiling. Fresh market prints show the spot contract hovering near $66.73, marking a 1.21 percent gain from the prior close of $65.93, supported by elevated trading volumes running at 4.38 times the 20-day average.
Technical Indicators Signal Fading Momentum Inside Range
Momentum readings across short-term timeframes reflect a consolidation environment devoid of a distinct directional drive. On the 4-hour charts, the Relative Strength Index is tracking close to the 50 neutral threshold, while daily data places the 14-period RSI at 55. Concurrently, the Moving Average Convergence Divergence oscillates adjacent to the zero line. Daily technical readings place the MACD at 0.33 against a signal line of 0.37, resulting in a slightly bearish histogram reading of -0.04. The 14-period Average Directional Index sits at 15, confirming the lack of a dominant trend and underscoring rangebound conditions. Price action remains nestled within the Bollinger Bands spanning $62.79 to $68.97, hovering near the $65.88 middle band. The fast line of the Stochastic oscillator is positioned at 73 alongside a signal line of 62, while the 14-period Average True Range stands at 1.62. Daily pivots identify key barriers at a pivot of $67.15, with overhead resistance at R1 $67.64 and R2 $68.54, balanced by downside cushions at S1 $66.25 and S2 $65.76.
Critical Overhead Barriers and Downside Support Triggers
Buyers continue to find the $68.00 barrier unyielding, with that ceiling repeatedly halting upward advances throughout September. A definitive breakout confirmed above $68.00 would pave the way toward the late August and mid-June peaks positioned within the $71.12 to $71.56 corridor. The broader 20-day technical resistance aligns near $71.16. Conversely, pullbacks are expected to discover intermediate cushions near Tuesday's intraday trough around $64.60 before confronting the lower boundary of the consolidation range at $62.30, corresponding to the lows recorded on September 14 and 16. A 20-day base support also rests nearby at $63.02. A clean break beneath the $62.30 threshold would validate an extensive Head and Shoulders chart formation, likely accelerating downward pressure toward the August 6 low at $60.90 and potentially exposing the August 4 swing low situated in the mid-$59.00s. Over a 52-week horizon, silver has fluctuated between $43.70 and $121.30, with a longer-term downward bias underscored by an EMA death cross where the 50-day EMA at $65.12 sits below the 200-day EMA at $66.86.
Silver as an Investment Vehicle and Pricing Dynamics
Silver holds a dual identity in global finance, serving both as an actively traded financial asset and an enduring store of wealth. Although gold attracts higher transaction volumes as the premier reserve asset, market participants frequently turn to silver to balance portfolio risks, capture its intrinsic worth, or hedge against inflationary pressure. Capital allocators gain exposure through physical holdings in minted bullion bars and legal tender coins, or navigate market fluctuations using derivatives and Exchange Traded Funds designed to mirror spot movements across international exchanges. Because the metal generates no periodic yield, its investment appeal tends to expand during accommodative interest rate cycles and contract when yields climb. Geopolitical friction and deep recessionary anxieties can provoke safe-haven inflows, though such impulses generally manifest with less intensity than in gold markets.
Currency Valuation, Industrial Demand, and Global Drivers
Given that international silver transactions are denominated in American currency under the XAG/USD ticker, fluctuations in the greenback exert immediate pricing consequences. A strengthening dollar makes the metal costlier for non-dollar holders, muting aggregate demand, whereas a depreciating dollar creates supportive tailwinds. Beyond currency mechanics, the metal's supply-demand equation differs markedly from gold due to geological abundance, extraction volumes, and secondary scrap recycling. A core analytical metric remains the Gold/Silver ratio, which computes the volume of silver required to equal one ounce of gold. Market strategists view an elevated ratio as an indication that silver is undervalued or gold is overpriced, while a depressed ratio implies relative silver overvaluation.
Industrial absorption represents the defining operational divergence between the two precious metals. Silver possesses the highest electrical conductivity of any metal on earth, surpassing both gold and copper. This physical characteristic makes it indispensable to electronic components, circuitry, and high-efficiency photovoltaic solar cells. Consequently, broader economic activity in manufacturing superpowers heavily dictates price movements. In the United States and China, sprawling industrial sectors consume substantial quantities across industrial manufacturing. Meanwhile, in India, retail jewelry consumption and traditional household demand serve as a major pillar supporting global baseline pricing.
Cross-Asset Movements and Macroeconomic Background
Broader commodity and currency benchmarks reflect the prevailing influence of Federal Reserve policy. Gold has struggled to sustain its rebound from sub-$4,300 regions, meeting fresh selling as the US Dollar index touched its highest level since July 30. In foreign exchange, AUD/USD dipped toward 0.7100 during Wednesday's Asian trading after Australian preliminary manufacturing activity slipped into contraction, paired with subdued services expansion. USD/JPY remained elevated in the mid-157.00s despite the Bank of Japan raising its short-term rate target from 1.00% to 1.25% in a 7-2 vote, as the move was widely anticipated and intervention caution capped further Yen depreciation. Geopolitically, financial participants are closely tracking the upcoming summit in Washington on Thursday between United States President Donald Trump and Chinese President Xi Jinping, which could set the tone for bilateral trade relations following months of easing tensions. In digital assets, Cardano surged past $0.262 with weekly gains topping 14% on derivatives volume expansion. As cross-market developments unfold, silver remains tethered to its immediate technical boundaries.