





















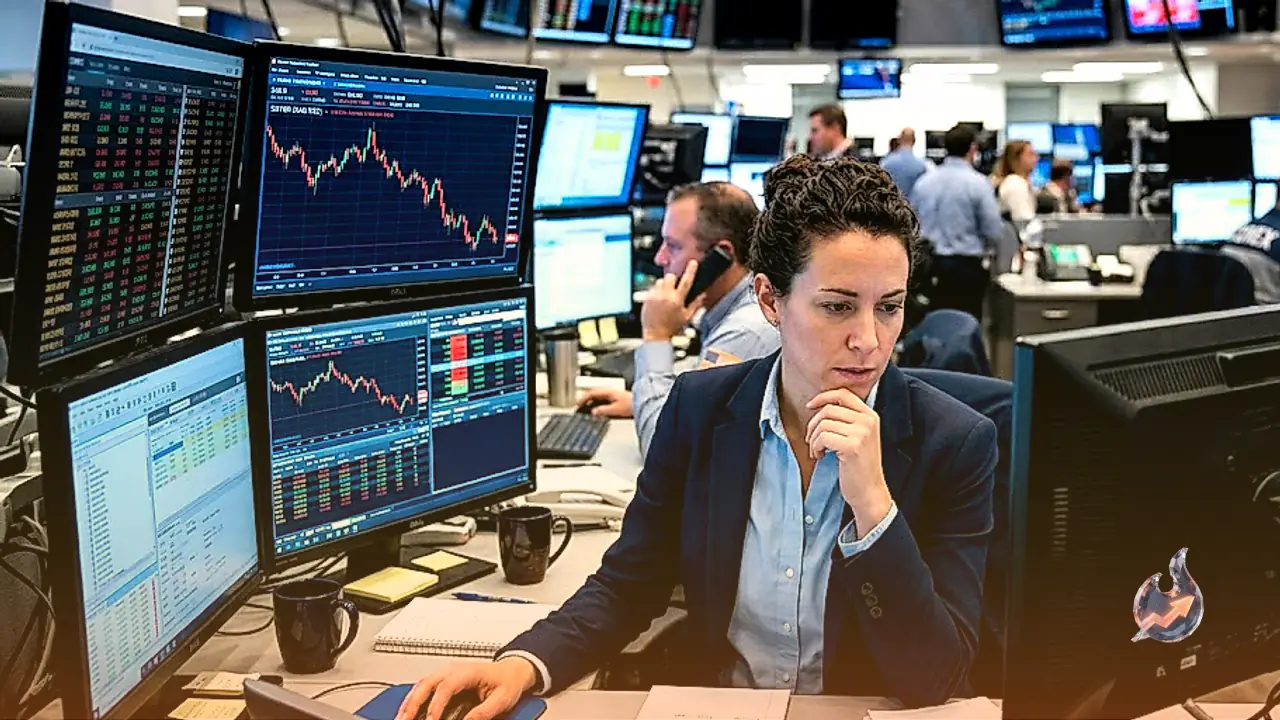

Silver prices have retreated toward $67.87 amid mounting market caution ahead of the release of the US Personal Consumption Expenditures (PCE) inflation data for July. Investors are maintaining a defensive stance while awaiting both the inflation figures and the outcomes emerging from the Jackson Hole Symposium.
PCE Inflation Outlook and Consumer Spending
Market analysts expect the annualized core US PCE inflation rate to remain steady at 3.4%. According to insights from TD Securities, the upcoming July inflation data should keep the Federal Reserve's preferred inflation gauge closely aligned with its objectives. Analysts anticipate that core PCE inflation will land within the Fed's target zone for a second consecutive report in July, despite edging up by 0.24% month-on-month. Furthermore, headline prices are projected to have risen by a tamer 0.15%, while market-based core PCE is anticipated to stay contained at 0.13% month-on-month.
On the economic activity front, soft retail sales data points toward a slowdown in consumer spending, which is projected at 0.2% month-on-month for July and a softer 0.1% in real terms. Looking further ahead, a gradual resumption of disinflation is anticipated heading into 2027.
Technical Indicators and Price Momentum
According to FX Economic Calendar metrics, the annualized core PCE inflation reading is widely forecasted to register a steady 3.4% expansion. Live market figures position Silver (SI=F) at $68.54, down 1.33% from its previous close of $69.47. XAG/USD trades around $67.87, retaining a constructive near-term bullish bias as prices hold firmly above the 20-day exponential moving average positioned at $64.64.
The Relative Strength Index (RSI) hovers near 61.7, staying in positive territory to signal that upward momentum remains intact despite the recent phase of consolidation. Live technical indicators show a 14-period RSI of 64, alongside a MACD reading of 1.95 versus its signal line of 1.22, confirming bullish momentum. The 52-week trading range spans between $38.51 and $121.30.
Support and Resistance Levels
On the downside, immediate support is established near the $64.64 region where the 20-day EMA acts as a primary demand zone. Any deeper pullback is likely to be viewed as a corrective move as long as prices sustain above this moving average. On the upside, the precious metal needs to clear the August 21 high near $70 to extend its rally toward the June 15 high of $71.33, followed by the broader June high at 77.00.
Live key levels indicate a pivot point at $68.81, with immediate resistances positioned at R1 $69.08 and R2 $69.62, while supports are marked at S1 $68.27 and S2 $68.00.
Drivers of Silver Valuation and Industrial Demand
Silver functions as a widely traded precious metal with a rich history as both a store of value and a medium of exchange. While less prominent than gold, market participants utilize silver for portfolio diversification, intrinsic value preservation, and as a potential hedge during periods of elevated inflation. Investors can acquire physical silver through coins and bullion or participate via Exchange Traded Funds that track global market pricing.
Price fluctuations in silver are influenced by a diverse array of catalysts. Geopolitical tensions or recession fears can elevate silver prices due to its safe-haven appeal, though to a lesser degree than gold. Being a yieldless asset, silver tends to appreciate in lower interest rate environments. Its valuation is also heavily tied to the US Dollar (USD), given that the metal is priced in dollars. A strengthening dollar typically restrains silver prices, whereas a weaker dollar acts as a bullish catalyst. Additional factors like investment demand, mining output, and recycling rates continuously shape market dynamics.
Industrial consumption remains a major pillar for silver demand, particularly within the electronics and solar energy sectors, owing to its superior electrical conductivity compared to both copper and gold. Surging industrial demand tends to drive prices higher, while softening demand exerts downward pressure. Economic performance across the United States, China, and India also drives significant price swings. Industrial activities in the US and China utilize large quantities of silver, while consumer jewelry demand in India plays a critical role in setting baseline valuations.
Furthermore, silver prices frequently track gold's trajectory due to their shared safe-haven characteristics. The gold-silver ratio, which measures the number of silver ounces required to purchase a single ounce of gold, helps investors assess relative valuations. A high ratio may suggest that silver is undervalued or gold is overvalued, while a low ratio can imply the opposite.
In broader currency and commodity markets, GBP/USD has pulled back from recent recovery gains, revisiting the lower 1.3600s amid mild downward pressure driven by a firmer greenback. Similarly, EUR/USD trades on the defensive around the 1.1660 region following Wall Street's closing bell. Meanwhile, gold touched a fresh peak since May 14 during the Asian session before encountering resistance below the $4,700 threshold, as short-lived downward pressure on US bond yields faded amid concerns over national debt levels surpassing $40 trillion. The US Treasury also announced plans to expand its liquidity support buyback operations across the 10-year to 30-year sectors starting September 9.