























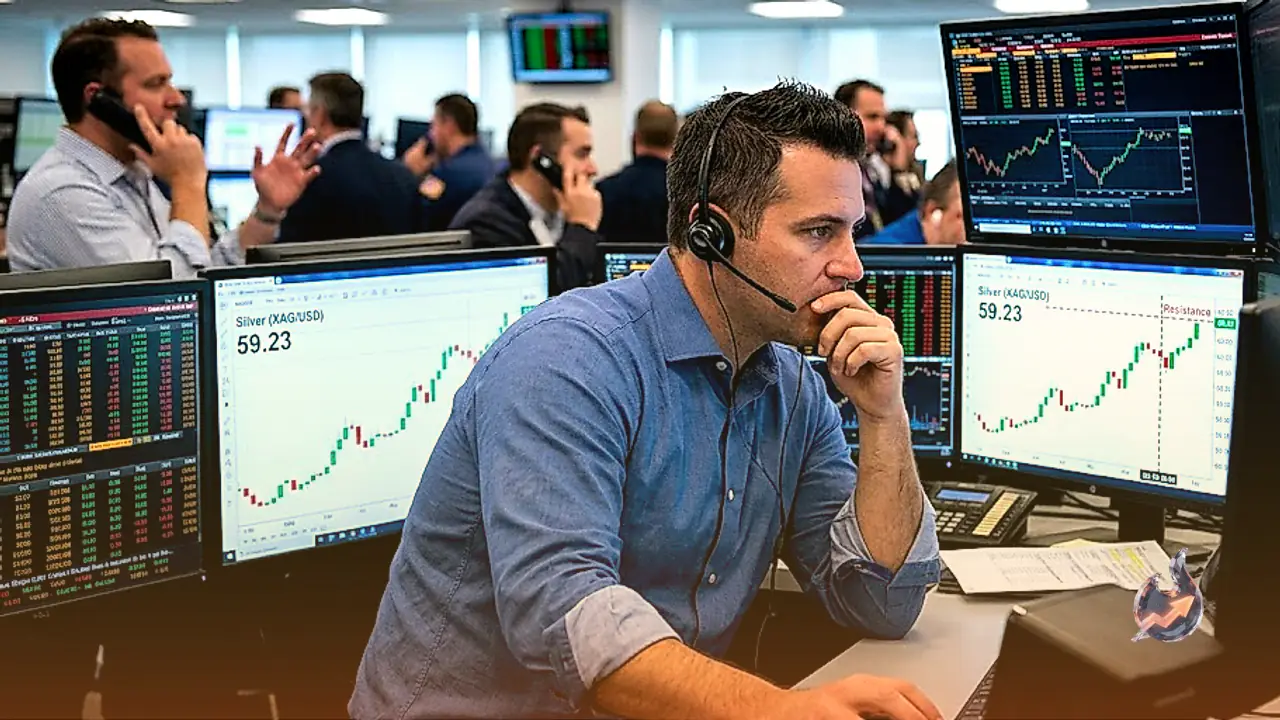

Silver has momentum returning to its price structure after two consecutive sessions of gains, allowing XAG/USD to successfully reclaim the $59.00 threshold. The precious metal is currently trading around $59.17, representing a 2.27% increase from its previous closing price of $57.86. This upward attempt comes on the heels of an eight-day consolidation phase during which market participants lacked clear directional bias. Despite the recent rebound, technical analysts note that silver remains constrained within a broader medium-term downward market structure, making the upcoming price hurdles crucial for determining whether this recovery can evolve into a sustained bullish trend.
Technical Indicators and Key Price Barriers
Momentum indicators are signaling early signs of stabilization for silver. The Relative Strength Index (RSI) on the daily timeframe sits at 47, recovering steadily over the past four trading sessions. Although an RSI reading below 50 typically reflects a bearish market regime, the upward slope indicates diminishing selling pressure and growing buyer participation. Simultaneously, the Moving Average Convergence Divergence (MACD) displays a bullish signal crossover, with the MACD line rising to -1.66 above its signal line at -2.21, generating a positive histogram value of 0.55. Additionally, the Average True Range (ATR) indicates daily volatility around $1.75, providing market participants with a key buffer for stop-loss management.
For buyers to establish a firm bullish continuation, silver must decisively conquer the psychological $60.00 resistance mark. Successfully clearing $60.00 would open the path toward immediate resistance level R1 at $60.12 and subsequently expose the July 22 swing peak of $60.94. A breach beyond that zone would challenge the key $61.00 level alongside upper technical boundaries near resistance level R2 at $61.07 and the 20-day upper Bollinger band at $61.81. Conversely, if selling pressure resurfaces, bears must force silver back below the July 28 daily trough of $56.64 and support level S1 at $57.67. A failure at these levels would leave the white metal vulnerable to retesting support level S2 at $56.17, 20-day support near $55.01, and ultimately exposing its yearly low of $54.77.
From a longer-term structural perspective, silver continues to navigate a challenging technical landscape. Over the past 52 weeks, prices have spanned a wide range between $36.35 and $121.30. Current trading prices remain below both the 50-day Exponential Moving Average (EMA50) at $63.68 and the 200-day Exponential Moving Average (EMA200) at $63.87, as well as the 50-day Simple Moving Average (SMA50) at $64.63 and the 200-day Simple Moving Average (SMA200) at $69.86. A technical death cross condition, where shorter-term moving averages sit below longer-term averages, underscores the ongoing macro pressure. However, a notable surge in trading volume, reaching 16.52 times its 20-day average, indicates heightened institutional interest and volatility around the current pivot level of $58.62.
Macroeconomic Catalysts and Foreign Exchange Dynamics
The primary catalyst underpinning silver's current advance is broad-based weakness in the US Dollar (USD) across global foreign exchange markets. A weaker Greenback typically provides immediate support to dollar-denominated commodities by lowering the cost of acquisition for international buyers holding foreign currencies.
Macroeconomic data released from the US revealed that preliminary second-quarter Gross Domestic Product (GDP) grew at an annualized rate of 1.5%. This fell short of financial market expectations of 2.1% growth, sparking concerns over potential economic deceleration. Furthermore, sentiment surrounding monetary policy has turned cautious after the Federal Reserve delivered a divided vote to keep benchmark interest rates unchanged, creating lingering uncertainty regarding the timing and magnitude of potential rate adjustments in September.
This macro backdrop triggered widespread movements across key currency pairs and precious metals
- Gold (XAU/USD): Gold advanced sharply, trading above $4,100 per ounce as investors sought haven assets amid the Greenback's post-policy retreat. Preliminary US GDP growth missing expectations further fueled demand for the yellow metal.
- EUR/USD: The European single currency rose to fresh six-week highs near 1.1530 during American trading sessions, boosted by widespread USD selling, weak US economic data, and ongoing market speculation surrounding potential foreign exchange intervention by Japanese monetary authorities (Bank of Japan / JPY).
- GBP/USD: The British Pound surged past the 1.3450 barrier to reach multi-week highs. This rally was fueled after the Bank of England (BoE) opted to maintain its benchmark interest rate at 3.75%. The Monetary Policy Committee (MPC) voted 6-3 to hold rates steady, with three dissenting members actively voting for an immediate interest rate hike, contrasting with the softer US economic backdrop.
Silver as an Investment and Industrial Asset
Silver occupies a unique position in global financial markets, functioning simultaneously as a monetary store of value and a critical industrial commodity. Historically utilized as currency and medium of exchange, physical silver remains a popular choice among retail and institutional investors seeking portfolio diversification or a hedge against high inflation environments.
Market participants access silver exposure through physical forms, such as minted coins and bullion bars, or through financial instruments like Exchange Traded Funds (ETFs) that track spot prices on international exchanges. Because silver generates no periodic yield, lower benchmark interest rates enhance its relative attractiveness compared to fixed-income assets. Furthermore, physical availability is governed by mining supply, where silver is often extracted as a byproduct of other base metals, and secondary recycling rates, making its supply structure distinct from gold.
Beyond its financial role, silver's physical properties make it indispensable to modern industry. Possessing the highest electrical and thermal conductivity of all metals, surpassing both copper and gold, silver is a fundamental component in advanced technology sectors. Industrial demand is heavily anchored by the photovoltaics sector for solar energy panel manufacturing and the high-tech electronics industry. Global consumption patterns are heavily influenced by industrial production dynamics in the US and China, while consumer demand for silver jewelry in India plays a vital role in physical market supply-demand dynamics.
The Gold-to-Silver Ratio and Relative Valuation
In commodity trading, silver prices frequently track the broader price trajectory of gold due to their shared status as precious metals and safe-haven stores of value. When gold experiences buying pressure, silver typically follows suit, though often displaying higher percentage volatility during momentum swings.
To evaluate relative pricing efficiency, traders utilize the Gold-to-Silver ratio, which measures the number of silver ounces required to equal the market value of one ounce of gold. An elevated Gold-to-Silver ratio suggests that silver may be historically undervalued relative to gold, or conversely, that gold is overextended relative to silver. Value-oriented investors often interpret a high ratio as an entry signal to accumulate silver in anticipation of mean reversion. Conversely, a declining ratio indicates that gold may be undervalued relative to silver, guiding asset allocation adjustments across the precious metals complex.