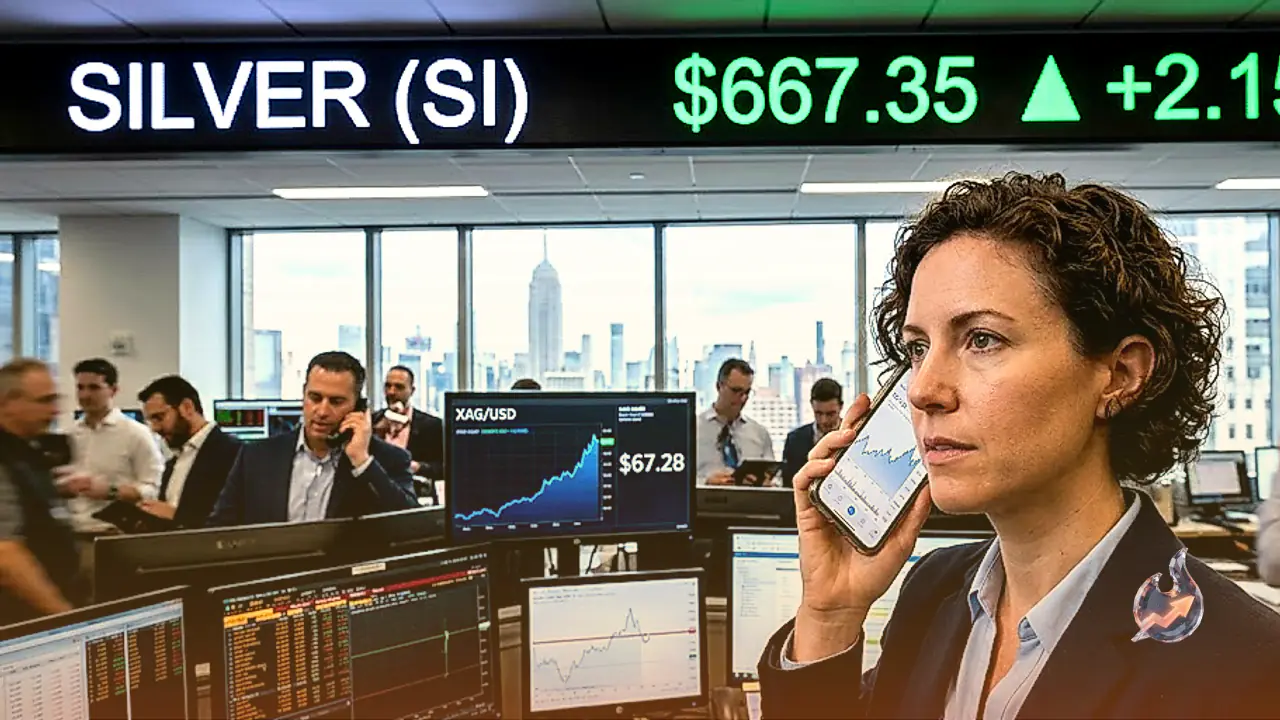























Comments from Federal Reserve Governor Christopher Waller generated widespread downward pressure on the US dollar and Treasury yields, helping spark a swift relief rally across precious metals. Silver (XAG/USD) capitalized on the shift, advancing firmly toward its critical 100-day Simple Moving Average (SMA) around $67.66. Having turned upward after testing the neutral 50 threshold on the Relative Strength Index (RSI), short-term momentum has rotated back in favor of buyers. However, the white metal continues to trade beneath a long-term structure of lower highs and lower lows established after reaching its historical peak of $121.66.
Key Technical Resistance and Downside Targets
From a technical standpoint, the immediate hurdle for silver bulls remains the 100-day SMA at $67.66. A sustained break above this level would open the door toward the August 28 swing high at $71.12, followed closely by the 200-day SMA positioned at $72.78 (with live technical measures registering the 200-day SMA at $71.83). Should buyers clear these obstacles, the path widens toward the May 25 high at $78.83, ahead of the round psychological figure at $80.00.
On the downside, if XAG/USD fails to overcome the 100-day SMA, sellers could attempt to reassert control and push prices down toward the September 2 swing low at $63.32. A decisive break beneath that floor would target the 50-day SMA at $61.85, with further bearish extension threatening a drop toward $60.00. Live trading figures show silver exchanging hands near $67.68, reflecting a daily jump of 4.56 percent on expanding volume.
Dollar Weakness Drives FX and Metal Rebounds
The broader retreat in the greenback has spilled over into key foreign exchange and commodity pairs. USD/JPY bounced off multi-month lows toward the 156.00 handle ahead of the Asian trading session, driven by market expectations that the Bank of Japan (BoJ) might deliver another interest rate increase during its September 18 policy meeting.
Simultaneously, AUD/USD extended its midweek advances, breaking past four-month highs above 0.7200 late in the session. Traders are carefully positioning ahead of the upcoming US Non-Farm Payrolls (NFP) report scheduled for Friday. Spot Gold also capitalized on lower US Treasury yields, reclaiming ground around the prominent $4,500 per troy ounce threshold.
Refined Fuel Markets Hit Record Spreads
Energy commodity dynamics present a contrasting picture of underlying supply constraints. While crude oil trading has remained relatively range-bound, the refined product segment is signaling acute tightness. The US diesel crack spread—the premium commanded by ultra-low sulphur diesel futures over WTI crude—crossed $100 per barrel for the first time, reaching a historic record high just above $102.00.
Fundamental Value Drivers and Industrial Uses
Silver occupies a distinct position among financial assets as both a precious store of value and an irreplaceable industrial component. Though smaller in total market capitalization than gold, silver provides investors with portfolio diversification and serves as a classic hedge during inflationary periods. Market participants access the asset through physical bullion coins and bars or via Exchange Traded Funds (ETFs) tracking international spot market prices.
Price fluctuations in silver stem from multiple macroeconomic channels. Geopolitical uncertainty and recession concerns reinforce its safe-haven appeal, though typically to a lesser degree than gold. Because silver pays no yield, lower interest rate environments diminish the opportunity cost of holding the metal. Furthermore, its USD-denominated pricing structure creates a strong inverse correlation with the greenback—a weaker US dollar directly boosts silver's purchasing power for foreign buyers.
Industrially, silver possesses the highest electrical conductivity of all metals, outperforming both copper and gold. This physical property makes it indispensable in high-tech sectors, particularly advanced electronics and solar photovoltaic manufacturing. Consumption dynamics across the US and Chinese industrial sectors, combined with Indian consumer demand for jewelry and physical metal, remain key determinants of long-term price action.
Understanding the Gold-Silver Ratio
Silver prices generally trend in tandem with gold due to their shared status as safe-haven assets. Analysts frequently monitor the Gold/Silver ratio—the number of silver ounces required to equal the value of one gold ounce—to assess relative valuation. A historically high ratio suggests that silver may be undervalued relative to gold, whereas a low ratio indicates that gold could be priced at a discount relative to silver.