























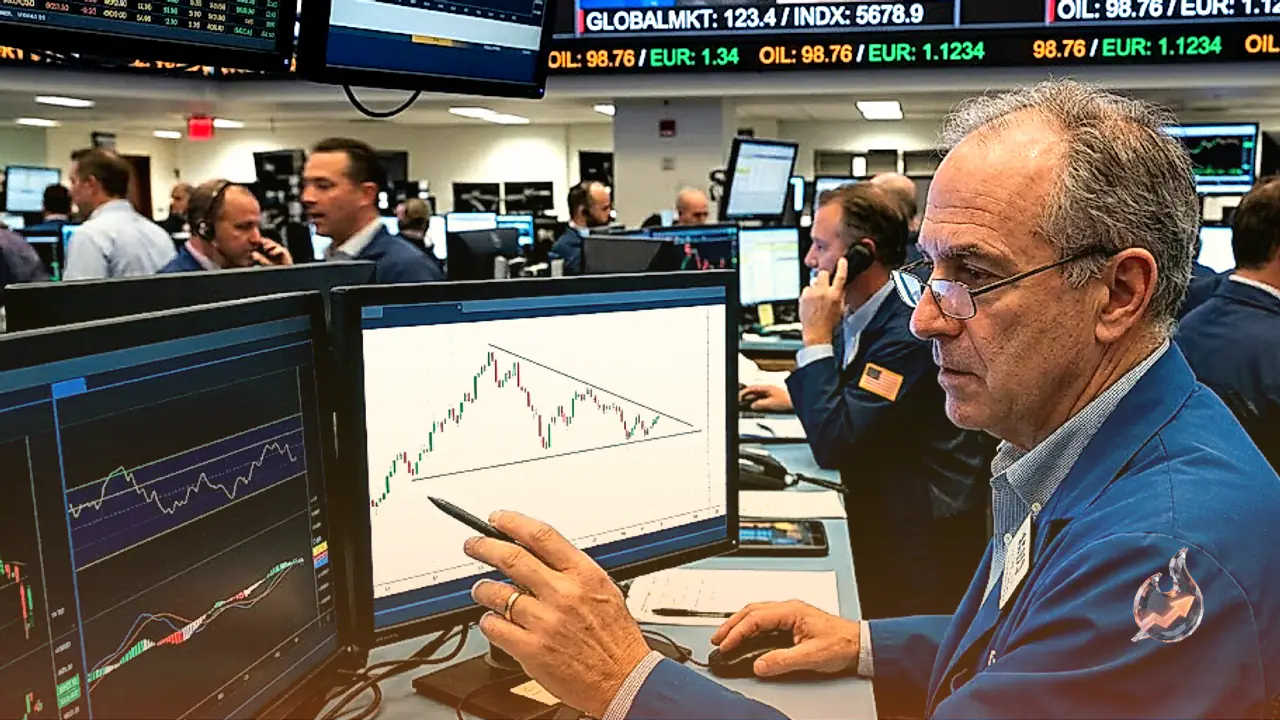

Gold is having a subdued start to the week. The metal edged only marginally higher on Monday, yet it still cannot shake off the tight band it has been stuck in for days near the $4,000 handle. Fresh signs that friction involving Iran might be easing took some of the nervous edge out of the market, and with traders feeling a little less need to hide in safe assets, bullion drifted sideways rather than pushing convincingly higher.
That hesitation shows up clearly on the charts. XAU/USD has been squeezed into the narrow tip of a descending triangle right around the $4,000 region, the kind of coiled formation that tends to store up energy before releasing it in one direction with force. The pair was changing hands at $4,021, and while the broader structure still leans bearish, a build-up of bullish divergence in the Relative Strength Index (RSI) suggests the sellers may finally be running low on ammunition.
What the momentum tools are saying
On the four-hour view, the RSI has clawed its way back toward a neutral setting after a spell in weaker territory, while the Moving Average Convergence Divergence (MACD) has flipped into positive gear. Together those shifts point to buying interest that is quietly building, even if it remains capped for now. In plain terms, the market is not screaming higher, but the downward pressure that dominated recent sessions is loosening its grip.
Live market readings back up that cautious picture. As of the latest close, gold was quoted around $4,085, up roughly 1.87% from the previous settlement of $4,010, with the past year's swings running all the way from $3,264 to $5,586. Trading volume was unusually heavy, about 18 times the twenty-day average, a sign that plenty of hands were changing at these levels. The 14-day RSI sat near 46, still short of the midpoint, while the MACD line at about -68.91 held above its signal near -80.56, leaving a positive histogram gap that echoes the four-hour improvement.
The levels traders are watching
The near-term battleground is the cluster of averages around $4,060 to $4,065, where the pivot, the Bollinger midline and a closely followed short-term average all converge. Reclaiming and holding that zone would hand the initiative back to buyers. Above it, resistance stacks up near $4,117 and again toward $4,150, with the wider ceiling closer to $4,200. On the downside, first support rests around $4,028, then $3,971, and a firmer floor near $3,963. The longer-term moving averages, however, tell a soberer tale: with the 50-period line well below the 200-period line, gold remains inside a broader downtrend, and the daily trading range of roughly $79 gives a sense of how much room any stop should allow.
Why gold still matters as a safe haven
Step back from the day-to-day squiggles and gold's enduring pull explains much of this positioning. For thousands of years the metal has served both as a store of value and as a means of exchange, and beyond its shine and its use in jewellery it is prized today as a safe-haven asset, something investors reach for when the outlook turns stormy. It also works as a shield against inflation and against currencies that are losing their purchasing power, precisely because it answers to no single government or issuer and cannot be printed at will.
Central banks lead the buying
Nowhere is that faith clearer than among the world's central banks, which collectively hold more gold than anyone else. When conditions get rough, they spread their reserves across assets and add bullion to bolster confidence in both their economies and their currencies, since a deep gold stockpile signals that a country can meet its obligations. The scale of that appetite has been striking: official institutions piled on 1,136 tonnes worth roughly $70 billion in 2022, according to the World Gold Council, the largest annual haul since such figures were first tracked. Emerging economies including China, India and Turkey have been especially aggressive in building up their holdings.
The dollar connection
Gold's path is tightly bound to the US Dollar and to US Treasuries, two of the planet's other big reserve and safe-haven assets, and that link runs in the opposite direction. When the greenback slips, gold typically climbs, giving investors and central banks a way to spread their bets when markets wobble. The metal also tends to move against riskier assets: a buoyant stock market usually drains some of gold's lustre, whereas a rush out of equities and other risk trades often sends money flowing back toward the yellow metal.
What moves the price from here
A long list of forces can swing the price. Geopolitical shocks or fears of a severe recession can lift gold quickly thanks to its haven reputation, which is exactly why the ebb and flow of the Iran situation matters so much right now. Because gold pays no yield, it generally benefits when interest rates fall and struggles when the cost of money climbs. Yet more than anything, its fate hangs on the dollar, since the metal is priced in that currency through XAU/USD. A strong dollar tends to keep a lid on gold, while a weaker one clears the way for it to rise. For now, with Iran tensions cooling and the pair pressed against the apex of its triangle, the market looks poised for its next decisive move, and the coming sessions should reveal which way the coil finally springs.