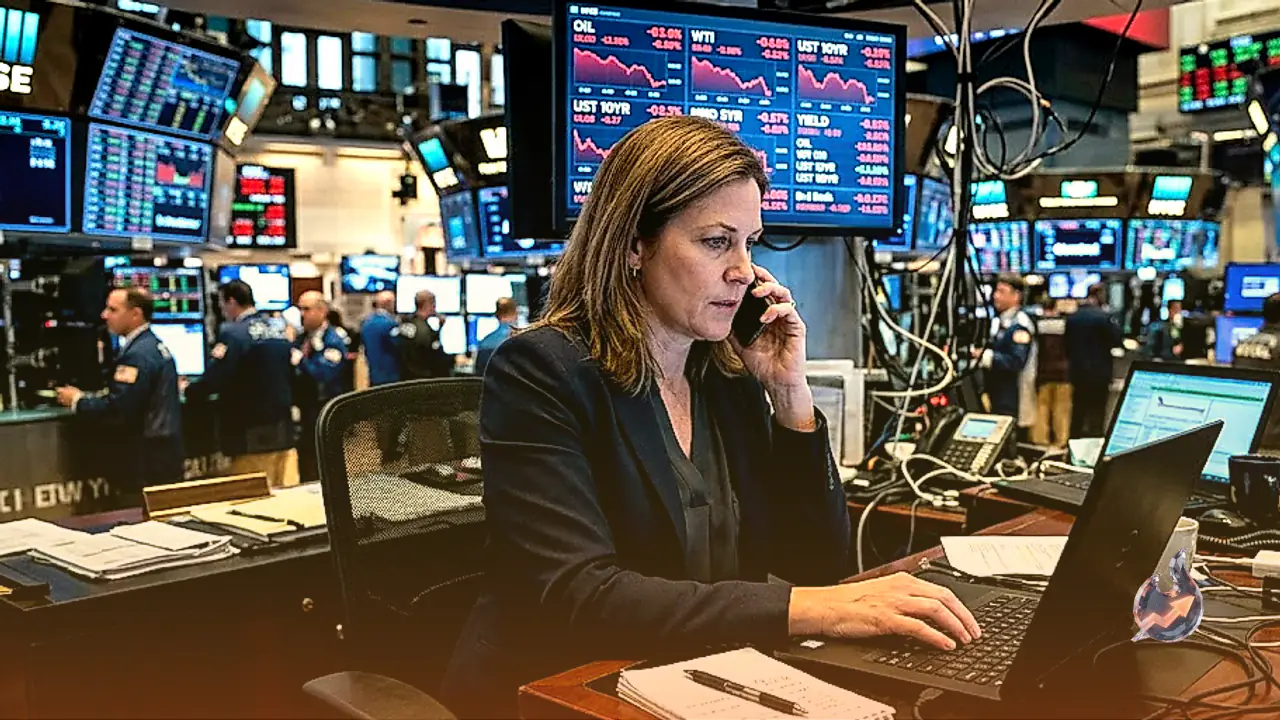
























The Thai Baht (THB) has experienced a notable rally against the US Dollar (USD), hitting a two-month peak amidst a broader decline in the Greenback index. This upward momentum has been propelled by a combination of supportive macro drivers, including easing global crude oil prices, robust electronics export figures, and steady gold-related capital flows. Trading near the 32.66 level, the spot price reflects ongoing demand for regional assets, though market analysts suggest that the currency pair may soon enter a phase of price consolidation.
Central Bank Caution and Policy Sensitivities
Despite the recent strength of the Baht, currency analysts at OCBC, including Sim Moh Siong and Christopher Wong, urge caution regarding further aggressive upside. The Bank of Thailand (BoT) is scheduled to hold its upcoming monetary policy meeting, and policymakers remain notably sensitive to excessive currency appreciation that could undermine Thailand's export competitiveness. The analysts highlighted that while weaker USD conditions and lower energy import costs provided clear relief, attributing the currency's advance primarily to the technology export cycle oversimplifies the broader macroeconomic backdrop.
Technical Indicators and Key Price Levels for USD/THB
From a technical standpoint, the USD/THB currency pair maintains an intact bearish momentum structure on the daily timeframe. However, the 14-day Relative Strength Index (RSI) stands at 33, placing it right on the verge of oversold territory. Moving average configurations show the 20-day Exponential Moving Average (EMA20) at 33.01, the EMA50 at 33.08, and the EMA200 at 32.54, alongside Simple Moving Averages of SMA50 at 33.24 and SMA200 at 32.28. Notably, the golden cross relationship between the EMA50 and EMA200 indicates that the long-term uptrend framework remains valid.
Key technical resistance is positioned at 32.87, aligned with the 100-day Moving Average (DMA), followed by stronger resistance at 33.14, representing the 23.6% Fibonacci retracement level of the 2026 low-to-high move. On the downside, solid support is clustered around 32.30/35, supported by the 200 DMA and the 50% Fibonacci retracement level. The Average True Range (ATR 14) rests at 0.20, reflecting standard daily volatility, while the 52-week trading bounds span between 30.82 and 33.86.
Broader Foreign Exchange Market Performance
The softer stance in the US Dollar resonated across other major currency pairs as well. EUR/USD recovered from two consecutive sessions of pullbacks to settle near 1.1670 following the Wall Street close, maintaining focus on the 1.1700 threshold. Market participants are preparing for upcoming US macroeconomic releases, specifically the Personal Consumption Expenditures (PCE) inflation index and the revised second-quarter Gross Domestic Product (GDP) report. Meanwhile, GBP/USD shook off earlier weakness to advance towards resistance around the 1.3650 zone.
Precious Metals, US Treasury Buybacks, and Tech Earnings
In commodities, Gold hovered near the midpoint of its daily range around $4,650 per troy ounce, drawing support from a general decline in US Treasury yields across the curve and a cautious market tone. In fixed income news, the US Treasury Department announced at 12:32 GMT an expansion of its liquidity support buyback operations. Effective from September 9 through November 4, the department will at least double the maximum operation size from $2 billion to $4 billion in both the 10-to-20-year and 20-to-30-year sector brackets. Concurrently, as the 2026 Q2 corporate earnings season concludes for S&P 500 constituents, investors are awaiting quarterly results from AI leader NVIDIA (NVDA) to wrap up reporting for the Magnificent Seven tech cohort.