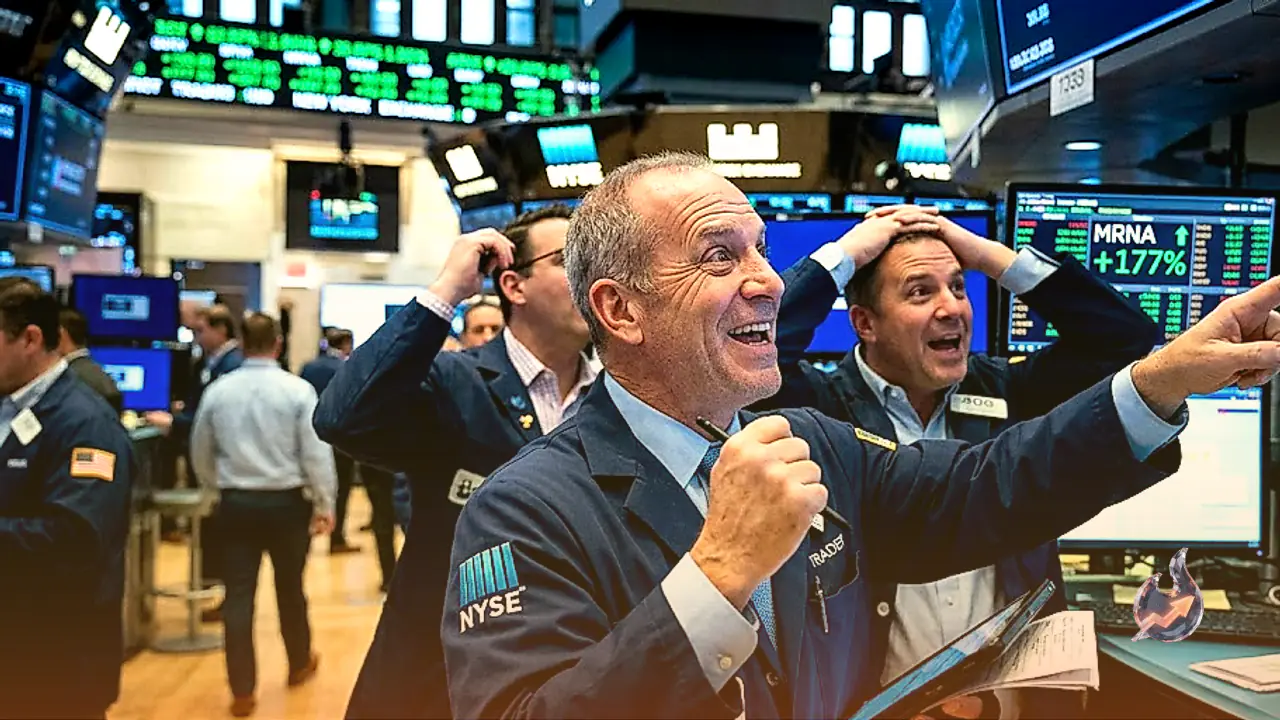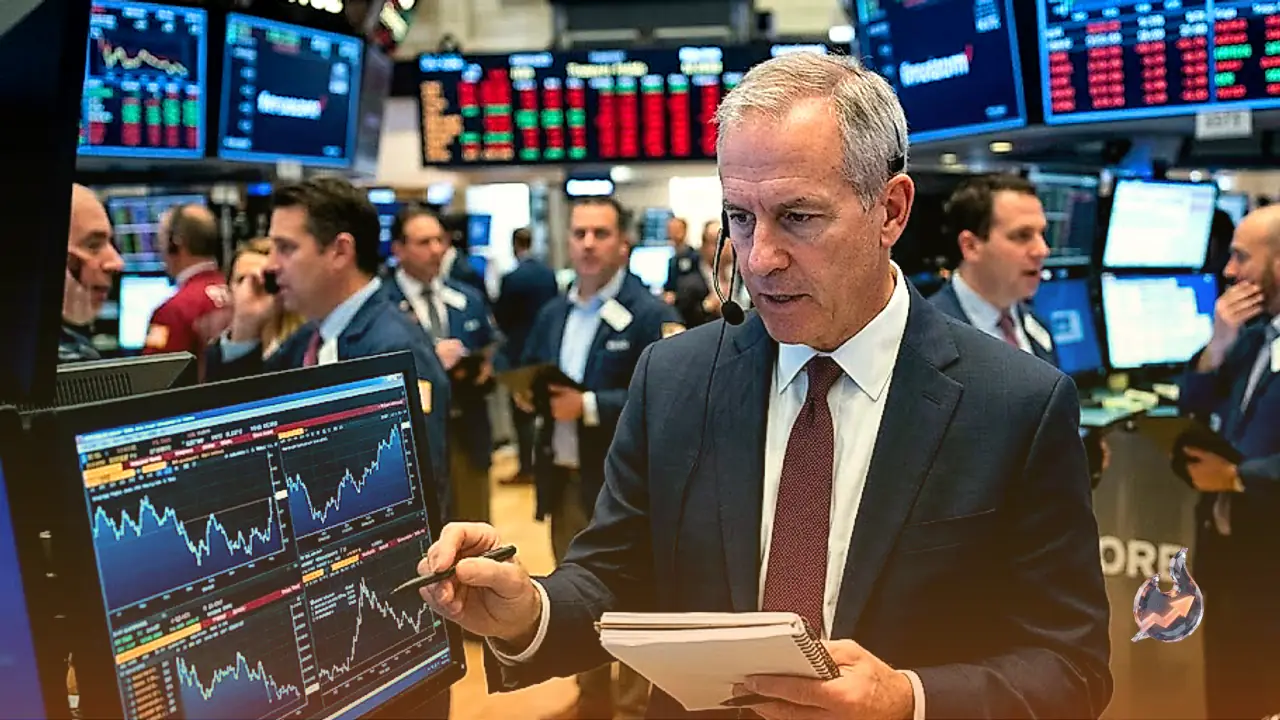























The US Dollar faced broad-based weakness during the European trading session on Thursday, enabling the Euro (EUR) to surge to a fresh three-month high of around 1.1693 against the US Dollar (USD). The rally in the major currency pair unfolded rapidly after the US Department of the Treasury announced a significant scaling up of its bond buyback operations in an explicit attempt to rein in escalating financing costs across long-dated government debt. The resulting plunge in long-term US Treasury yields knocked the Greenback off its footing across foreign exchange markets.
Reflecting the widespread selling pressure on the American currency, the US Dollar Index (DXY)—which measures the Greenback's value against a basket of six rival currencies—extended its downward slide to reach an 11-week low near 98.70. Market participants digested the Treasury's unexpected liquidity intervention, which has shifted near-term yield dynamics. Concurrently, expectations that the European Central Bank (ECB) remains on track to raise policy interest rates at its upcoming September meeting provided an additional tailwind for the shared European currency.
US Treasury Doubles Bond Buyback to Cap Borrowing Costs
The catalyst for the foreign exchange volatility originated on Wednesday at 12:32 GMT, when the US Department of the Treasury diverged from its standard issuance schedule to deliver a policy update. The department stated that effective September 9 through November 4, it will at least double the size of its liquidity support buyback operations. Specifically targeting the 10-year to 20-year and 20-year to 30-year maturity sectors, the maximum operation size will rise from $2 billion per operation to at least $4 billion.
This substantial expansion in debt repurchases is designed to absorb supply and suppress rising borrowing costs in long-duration Treasuries. By actively bidding for older, less liquid government bonds, the Treasury aims to improve secondary market functionality. However, the immediate market fallout has been a drop in long-term yields, diminishing the interest rate premium that had previously cushioned the US Dollar and prompting currency traders to reallocate capital into higher-yielding or strengthening alternatives like the Euro.
EUR/USD Technical Setup and Key Price Targets
From a technical analysis perspective, EUR/USD exhibits robust bullish momentum. On the downside, immediate technical support is anchored around the 20-day Exponential Moving Average (EMA) at 1.1547. Any temporary market pullbacks are expected to find buying interest near this zone before any deeper corrective move can develop. To the upside, once the currency pair establishes firm footing above the 1.1700 handle, technical pathways open for a retest of May's peak near 1.1800.
Real-time market pricing places EUR/USD at 1.17, representing a 1.02% gain over the prior session's close of 1.16. Over the past 52 weeks, the pair has traded within a range of 1.13 to 1.20. Daily volume continues to track evenly with its 20-day average at a 1.00x multiplier, confirming steady institutional participation accompanying the upward breakout.
UOB Group Perspective and Momentum Analysis
Currency strategists at UOB Group have maintained a constructive outlook on the pair. Recalling their stance earlier in the week, analysts noted that they initially turned positive on Monday, August 17, when spot traded at 1.1570, highlighting that price action suggested EUR was likely to trade with an upside bias. On Tuesday, August 18, with spot at 1.1580, UOB maintained its bullish stance while cautioning that EUR needed to break and hold above 1.1615 before expecting a push toward 1.1655 and beyond due to a temporary lack of explosive upward momentum.
That technical condition was decisively met on Wednesday as EUR cleared 1.1615, rallying sharply to an intraday peak of 1.1679 before closing at a three-month high of 1.1677, up 0.89% on the day. Following this surge, UOB Group updated its assessment, judging that current momentum leaves scope for further upside toward 1.1725. The institution reaffirmed its positive stance on EUR as long as spot remains above the strong support level of 1.1600, which was revised upward from the previous support benchmark of 1.1525.
Federal Reserve Policy Framework: QE, QT, and Currency Valuation
Understanding the fundamental backdrop of the US Dollar requires examining its systemic position in global finance. The USD is the world's primary transaction currency, participating in over 88% of all foreign exchange transactions with an average daily turnover of $6.6 trillion according to 2022 central bank survey data. Having superseded the British Pound as the global reserve currency following World War II, the USD was backed by gold until the 1971 dissolution of the Bretton Woods system transitioned global finance to fiat regimes.
The value of the US Dollar is fundamentally anchored by Federal Reserve monetary policy. Guided by its dual mandate of price stability (targeting 2% inflation) and maximum sustainable employment, the Fed adjusts the federal funds rate to manage economic cycles. Raising rates to combat above-target inflation generally appreciates the USD, while rate cuts during economic downturns dilute currency value. In severe crises, such as the 2008 Great Financial Crisis, the Fed employs Quantitative Easing (QE)—printing money to purchase bank-held Treasuries—which expands credit but depreciates the currency. Conversely, Quantitative Tightening (QT), where the Fed allows bonds to mature without reinvestment, contracts liquidity and supports dollar valuation.
Cross-Asset Market Reactions: Sterling, Gold, and Cryptocurrencies
The knock-on effects of the Treasury's announcement extended across multiple asset classes. GBP/USD consolidated near 1.3600 after easing from its highest mark since May 11, as traders weighed whether the buyback program would alter long-term structural dollar demand amidst upcoming US economic data releases and geopolitical headline risks in the Middle East.
Gold prices registered modest intraday declines during Asian trading, holding below $4,500 per ounce while remaining near early-June highs. Although a stabilizing dollar prompted brief profit-taking, lower Treasury yields restricted downside risk for the non-yielding metal. Meanwhile, cryptocurrency markets experienced a broad rebound led by top altcoins. Ripple (XRP) traded near $1.0951 following a 10% rally, with technical structures pointing toward further upside alongside Solana (SOL), while Cardano (ADA) navigated overhead resistance.
Live Market Indicators and Technical Oscillators
Quantitative indicator readings provide granular context on current EUR/USD price action. The 14-day Relative Strength Index (RSI) stands at 73, signaling that the asset has entered overbought territory on daily timeframes. The Moving Average Convergence Divergence (MACD) prints 0.00 against a 0.00 signal line with a positive histogram confirming bullish momentum.
Moving average alignments show the 20-day EMA at 1.15, 50-day EMA at 1.15, and 200-day EMA at 1.16, alongside the 50-day SMA at 1.15 and 200-day SMA at 1.16, reflecting an intact long-term structural uptrend. Bollinger Bands (20, 2) span from 1.14 to 1.17 with a 1.15 middle band, placing current spot right at the upper envelope. The Average Directional Index (ADX 14) reads 32, confirming strong trend strength. Stochastic fast and signal lines sit at 99 and 79 respectively. Risk management models point to an Average True Range (ATR 14) of 0.01 for volatility stop placement, while pivot calculations place central pivot, R1, R2, S1, and S2 all near the 1.17 zone.