























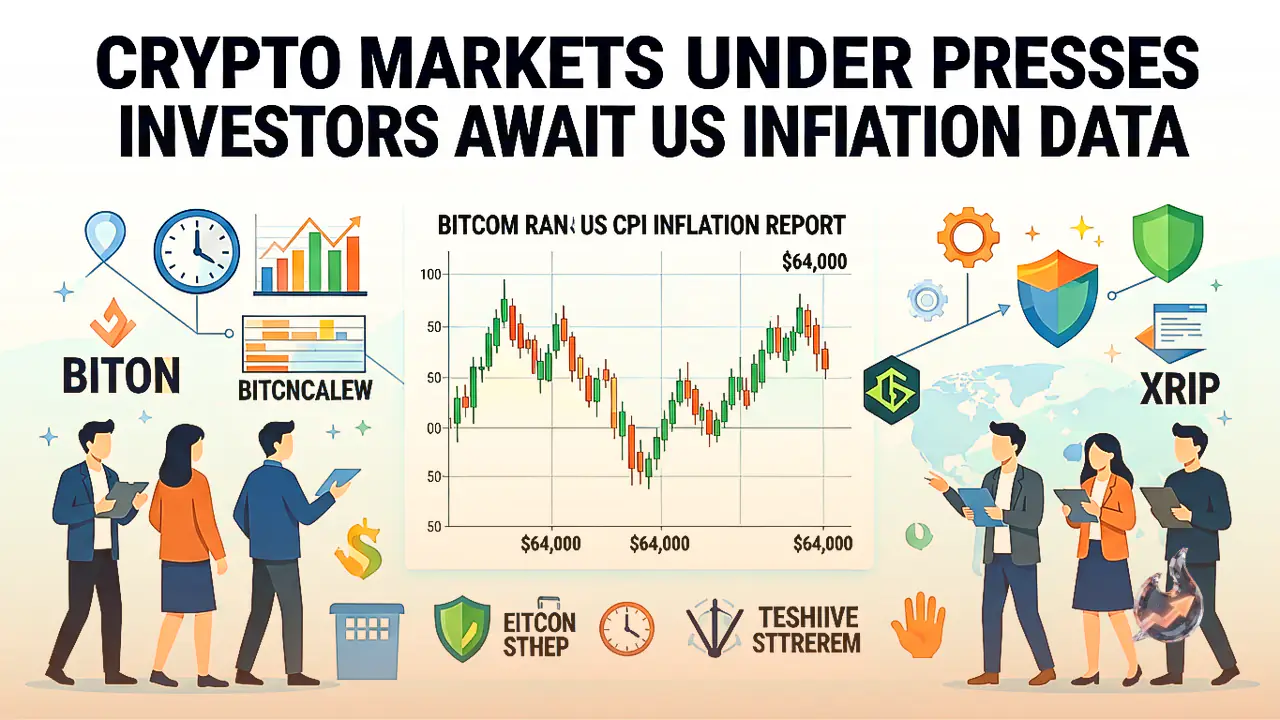

Global cryptocurrency markets are exhibiting marked caution as investors brace for the release of the latest United States Consumer Price Index report. Major digital assets remain range-bound with technical indicators pointing toward persistent short-term bearish pressure. Market participants are closely watching the upcoming data from the US Bureau of Labor Statistics, which could significantly influence Federal Reserve monetary policy and future interest rate trajectories. Amid this macroeconomic uncertainty, selling pressure remains evident across key trading pairs.
Bitcoin Technical Analysis and Key Resistance Levels
Bitcoin, the world's largest cryptocurrency by market capitalization, continues to trade under pressure below the psychologically critical $64,000 mark at $63,821. Live market data shows spot prices near $63,446. From a technical perspective, Bitcoin faces strong overhead resistance at its 50-day Exponential Moving Average of $64,584 and its 100-day EMA of $66,723. Further up, the long-term 200-day EMA sits at $73,129, representing a substantial hurdle for any medium-term recovery.
On the downside, initial support for Bitcoin is established along an ascending trendline near $63,458, reinforced by underlying demand at the Parabolic SAR level of $62,753. However, momentum metrics remain tilted to the downside. The daily Relative Strength Index hovers around 48, while the Moving Average Convergence Divergence histogram remains negative. These indicators suggest that upward rallies may continue to meet firm resistance as long as prices remain capped beneath the clustered EMAs.
K33 Research Insights on Market Consolidation
In a weekly analysis published by crypto intelligence firm K33 Research, market analysts highlighted that Bitcoin has spent six consecutive months consolidating in a range between $60,000 and $80,000. Trading volume and market participation have subdued amid typical summer doldrums. Researchers observed that unlike the historical bear cycles of 2014, 2018, and 2022—which were characterized by lower lows—Bitcoin reached a 50% drawdown from its all-time high on February 5 and has maintained that level through August 11, signaling investor apathy rather than a fundamental breakdown.
Ethereum and XRP Technical Breakdown
Ethereum is currently trading around $1,893. Although Ether remains above its 50-day EMA at $1,865 and the latest Parabolic SAR support at $1,829, its upside remains capped by the 100-day EMA at $1,924. A more distant resistance barrier sits at the 200-day EMA near $2,166. Momentum for Ethereum appears neutral to weak, with the RSI near 55 and the MACD residing below zero, indicating that recovery efforts may struggle to gain momentum without a decisive catalyst.
XRP is hovering around $1.02, remaining firmly in a downtrend below the Bollinger middle band at $1.06 and the 50-day EMA at $1.09. Broader resistance levels are positioned at the 100-day EMA ($1.18) and the 200-day EMA ($1.37). XRP experienced a 6.5% decline in August, bringing its total drawdown from the July peak of $1.18 to nearly 14%. The lower Bollinger band near $1.00 serves as key immediate support; a break beneath this floor could trigger further corrective price action.
Impact of US CPI Inflation Report on Crypto Asset Class
The upcoming Consumer Price Index report from the US Bureau of Labor Statistics is expected to serve as a pivotal market catalyst. Consensus estimates anticipate a slight moderation in monthly consumer inflation, forecasting a 0.1% increase for July compared to the 0.4% surge recorded in June. On an annual basis, headline CPI is expected to edge lower to 3.4% from 3.5%. A softer inflation reading could bolster expectations for potential interest rate cuts by the Federal Reserve, potentially providing relief to risk assets including cryptocurrencies.
Altcoin Performance and Broader Market Structure
Among other altcoins, PI token is holding steady near $0.0887 following a 2% gain on Tuesday, supported by increased retail interest and stable futures positioning around $0.08397. Conversely, Uniswap experienced sharp selling, dropping nearly 6% on Wednesday after a 5% decline the prior session. On-chain developments include the launch of Continuous Clearing Auctions on Avalanche, designed to facilitate token auctions and liquidity bootstrapping across networks.
Understanding broader market mechanics requires monitoring Bitcoin dominance—the proportion of total crypto market capitalization held by Bitcoin. Higher BTC dominance typically reflects risk-off sentiment where capital gravitates toward established digital assets. Meanwhile, stablecoins pegged to traditional currencies like the US Dollar continue to serve as essential liquidity vehicles and capital preservation tools during periods of heightened market volatility.