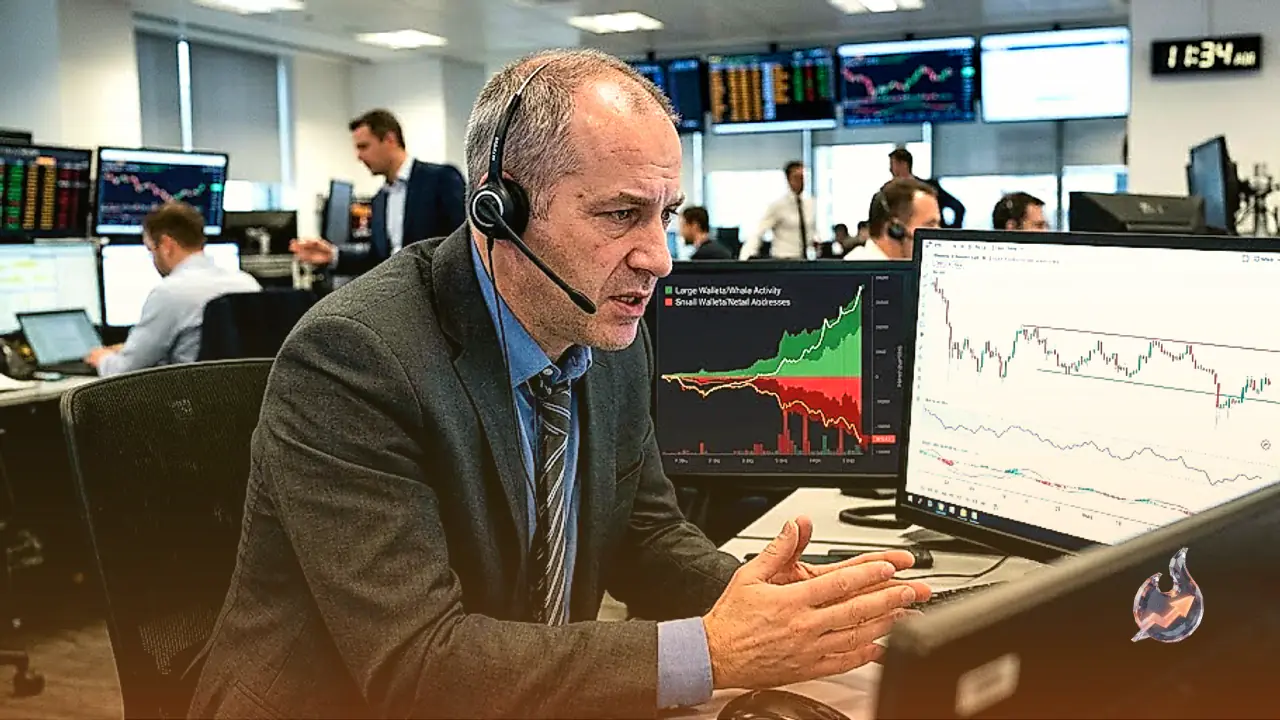
























The global cryptocurrency market displays a mixed and cautious trading environment as the flagship digital asset, Bitcoin (BTC), consolidates near the $63,000 mark. Broader market sentiment remains guarded, with Bitcoin capped under its 50-day Exponential Moving Average (EMA) at $64,488. Despite the prevailing risk-off mood across major assets, select altcoins including Cosmos (ATOM) and Pump.fun (PUMP) have managed to post significant gains over the last 24 hours, standing out as top market performers.
Bitcoin Technical Pressure and Crucial Price Thresholds
Bitcoin currently trades in the vicinity of $63,556, with live data reflecting trading action around $63,306. From a structural perspective, Bitcoin has breached a key ascending support trendline near $63,955, converting it into an overhead resistance barrier. Furthermore, the asset remains positioned beneath both its 50-day EMA at $64,488 and its 200-day EMA at $72,432, maintaining a bearish bias in the medium term.
Technical indicators further underscore the prevailing weakness. The Moving Average Convergence Divergence (MACD) continues to hover below its signal line in negative territory. Concurrently, the Relative Strength Index (RSI) sits near 46 (with live metrics reading 45), pointing toward subdued momentum without entering oversold conditions.
To the downside, initial support rests at the July 6 low of $61,307, followed by the July 1 swing low of $57,800. On the upside, immediate resistance is positioned at the broken trendline of $63,955, with the 50-day EMA at $64,488 acting as the secondary hurdle for buyers trying to reclaim bullish momentum.
Cosmos (ATOM) and Pump.fun (PUMP) Outperform Market Trend
Bucking the general market deceleration, Cosmos (ATOM) recorded a 3% surge on Friday, building upon a 7% advance achieved during the previous trading session. ATOM maintains a strong near-term structure following a decisive breakout above a multi-month resistance trendline around $1.3500 last week. The token is currently holding comfortably above its 50-day EMA at $1.4857.
Oscillators for Cosmos favor further upside, with the MACD expanding upward in positive territory and the RSI hovering around 65. Analysts highlight the R2 Pivot level at $1.7703 as the main upside target for ATOM, representing a potential upside of approximately 15%. On the downside, the 50-day EMA at $1.4857 and the retested trendline level at $1.2854 serve as key defensive floors.
Simultaneously, Pump.fun (PUMP) has demonstrated robust momentum. However, its RSI standing at 76 indicates overbought territory, suggesting the potential for short-term consolidation. Downward retracements are expected to find support around the May 9 peak of $0.002251, reinforced by the 200-day EMA at $0.002196.
Overview of Ripple, Ethereum, and Hyperliquid
Among other major cryptocurrencies, Ripple (XRP) continues to trade with a soft bias above its immediate support of $1.00. XRP has experienced a steady pullback since its July high of $1.18, reflecting diminished buying interest and a lack of fresh fundamental catalysts to spur a recovery.
Ethereum (ETH) is attempting to consolidate near the critical $1,900 resistance level as traders await clearer directional signals from the broader macro environment.
Conversely, Hyperliquid (HYPE) exhibits positive price movement, advancing toward its 50-day EMA at $58.36. Institutional interest remains steady, highlighted by a $31 million fair value increase in Hyperliquid treasury Hyperion DeFi during the previous quarter.
Sentiment Indicators and Broader Market Outlook
The CoinMarketCap Crypto Fear and Greed Index stands at 37, stabilizing within the fear zone. This reflects persistent risk-averse conditions among investors. Hesitant institutional flows and neutral-to-bearish momentum metrics suggest that market participants remain cautious, keeping broad market action range-bound in the near term.