
























Ripple, Solana and Cardano face downside risks as key altcoins test crucial support levelsCrypto
10 Sept 2026, 4:35 pm (1 hour ago)· 2

Ripple, Solana and Cardano face downside risks as key altcoins test crucial support levels

Major altcoins including Ripple, Solana, and Cardano are navigating a volatile market environment with technical indicators pointing toward potential support tests.

SOLSMA20 SMA50 · RSI · MACD
Candles + SMA20/50 · RSI(14) · MACD(12,26,9) with buy/sell signals — live from Yahoo

Technical Analysis10 Sep 2026

Moving AveragesEMA 20 / 50 / 200

What it is

Exponential Moving Averages smooth price to reveal the trend over the short (20), medium (50) and long (200) term. Price above them and stacked upward is an uptrend; below them and stacked down is a downtrend.

Where it stands now

Solana trades at $101 versus EMA20 $99.26, EMA50 $90.85, EMA200 $94.44.

Possible move ahead

Dips toward EMA20 ($99.26) are where buyers defend.

RSIRelative Strength Index (14)

What it is

RSI is a 0–100 momentum gauge of recent gains versus losses. Above 70 is overbought (stretched), below 30 oversold (beaten down), and 50 is the neutral line.

Where it stands now

Solana's RSI is 57.

Possible move ahead

Watch a push above 60 or a slide under 40.

MACDMoving Avg Convergence/Divergence

What it is

MACD tracks the gap between a fast and a slow moving average; its signal line and histogram show momentum building or fading. The line above its signal is bullish, below is bearish.

Where it stands now

Solana's MACD line is below its signal.

Possible move ahead

The next signal-line crossover is the trigger to watch.

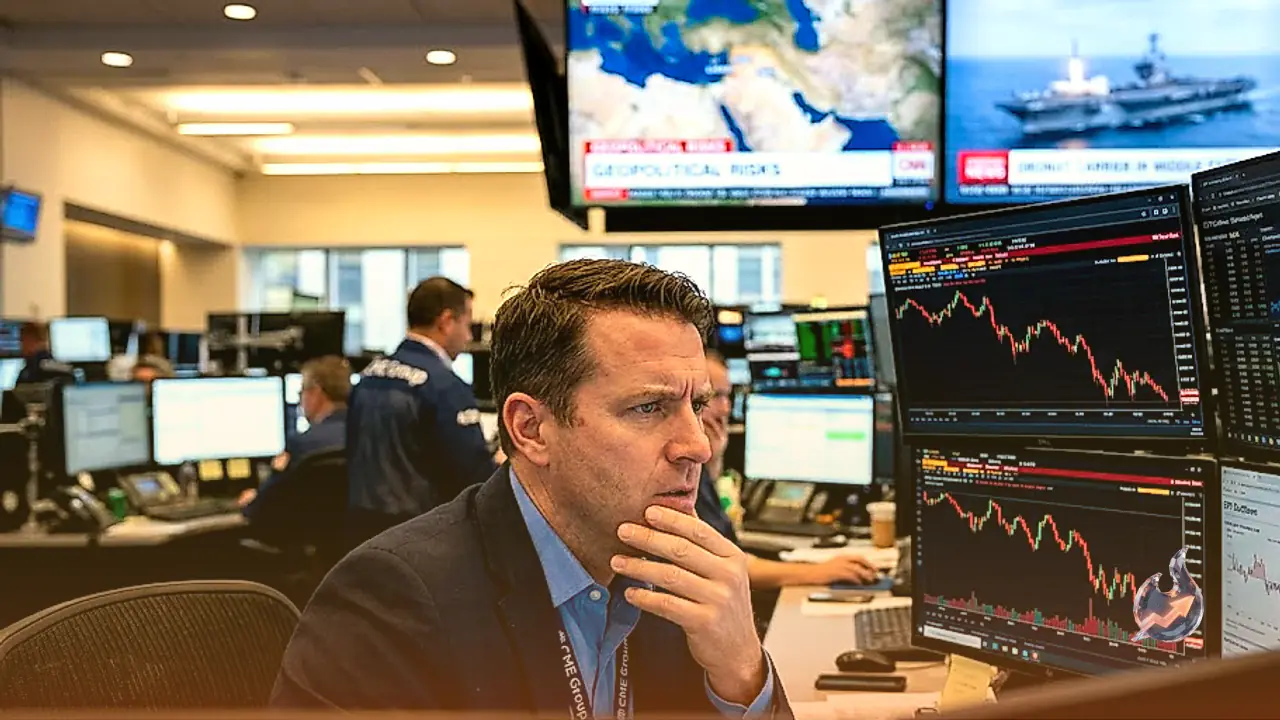
The digital asset market is currently experiencing renewed selling pressure across several leading tokens. As major altcoins like Ripple, Solana, and Cardano show mixed technical signals, market participants are closely monitoring critical support boundaries that could dictate the next major directional move.

Technical Indicators Point to Caution for Ripple and Solana

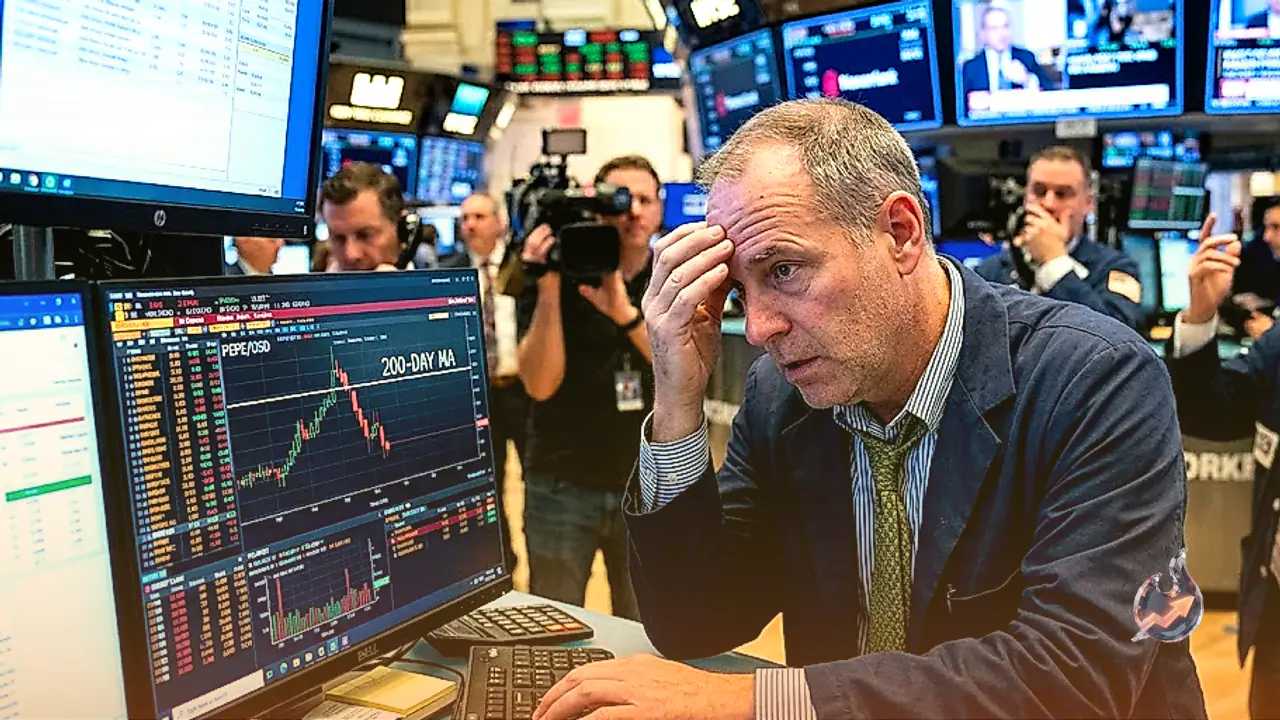
Ripple continues to trade under pressure, remaining below the 1.40 dollar threshold and extending previous losses. On the four-hour timeframe, the Relative Strength Index hovers around 41, slipping beneath the midline as buying momentum softens. Concurrently, the Moving Average Convergence Divergence indicator has declined below the zero line and the signal line, reinforcing expectations of further downside potential if demand fails to materialize.

Also read

Meanwhile, Solana remains positioned near the 100 dollar mark. Live market data places Solana at 100.91 dollars, marking a modest 0.69 percent decline from its previous close. Technical metrics for Solana show a 14-period RSI of 57, alongside a bearish MACD reading where the indicator trails its signal line. Despite these near-term pullbacks, Solana maintains a constructive structure supported by its longer-term moving average clusters.

Cardano Resilience and Broader Market Trends

Cardano presents a relatively stable short-term outlook, managing to hold above the 0.2100 dollar threshold following a modest recovery. Daily chart indicators show an RSI near 55, reflecting moderate bullish sentiment even as momentum cools slightly. Analysts note that maintaining these immediate support thresholds will be crucial for sustaining any upward recovery attempts in the near future.

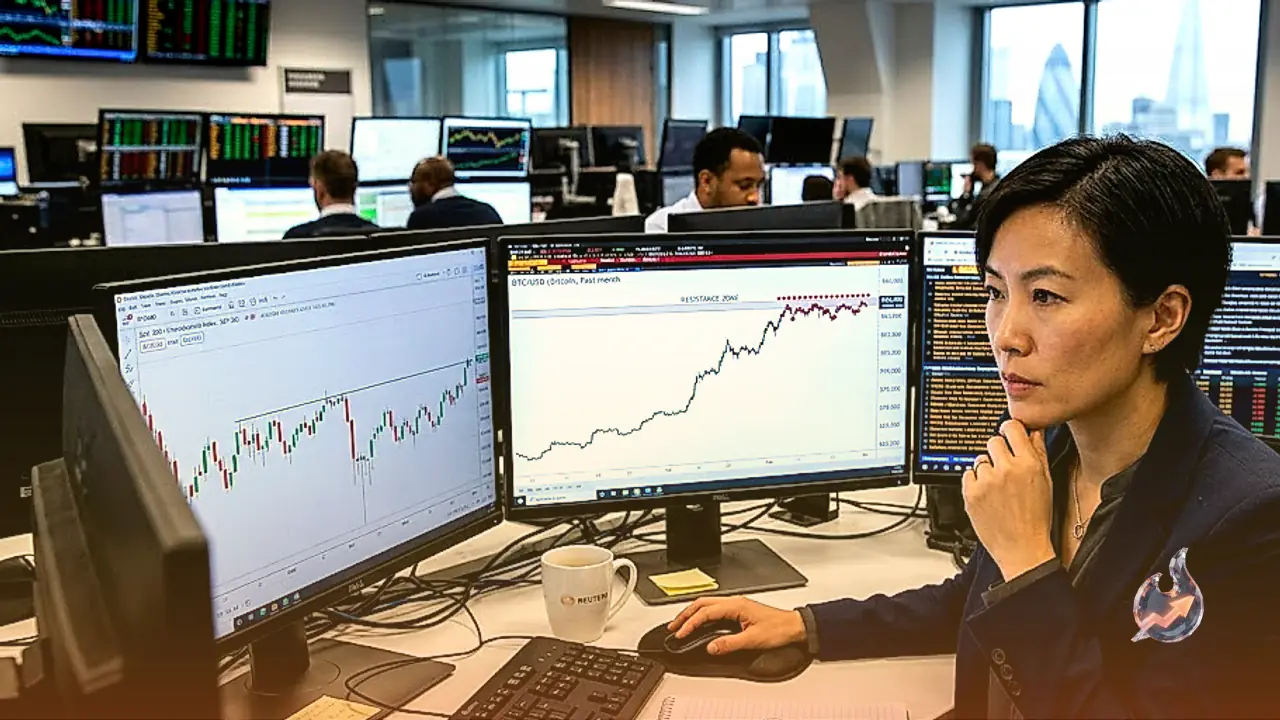
On a macro level, the broader cryptocurrency ecosystem continues to react to external pressures. Bitcoin trades below the 78,000 dollar mark, influenced by hawkish macroeconomic developments and shifting bond yields. Despite mid-year recovery efforts, top digital assets face robust resistance bands that limit aggressive upward breakouts.

Navigating Market Risks and Disclaimers

Market observers emphasize that digital asset trading involves substantial financial risk, including the potential loss of principal. Commentary and analytical data provided across financial platforms are intended solely for informational purposes and should not be construed as direct investment advice. Investors are advised to conduct independent research and evaluate their risk tolerance before entering volatile open markets.

Questions & Answers

What is Solana's current trading price according to live data?
Solana is currently trading at 100.91 dollars, down 0.69 percent from its previous close.
Where is Ripple trading relative to key psychological levels?
Ripple is trading below the 1.40 dollar threshold, extending losses from the preceding session.
How is Cardano performing on the charts?
Cardano is holding slightly above 0.21 dollars, attempting to stabilize after a brief corrective phase.
What do the RSI and MACD indicators suggest for altcoins?
The RSI moving below the midline and the MACD crossing beneath the signal line both point toward waning bullish momentum.

Comments 0

No comments yet — be the first.

Citizen journalism

Become a TrendKia journalist

Voice of the people

Share news, photos and videos from your area with TrendKia and let your voice reach the nation. Every citizen a journalist.

Join now
CH 01 LIVE
TrendKia TV ON AIR