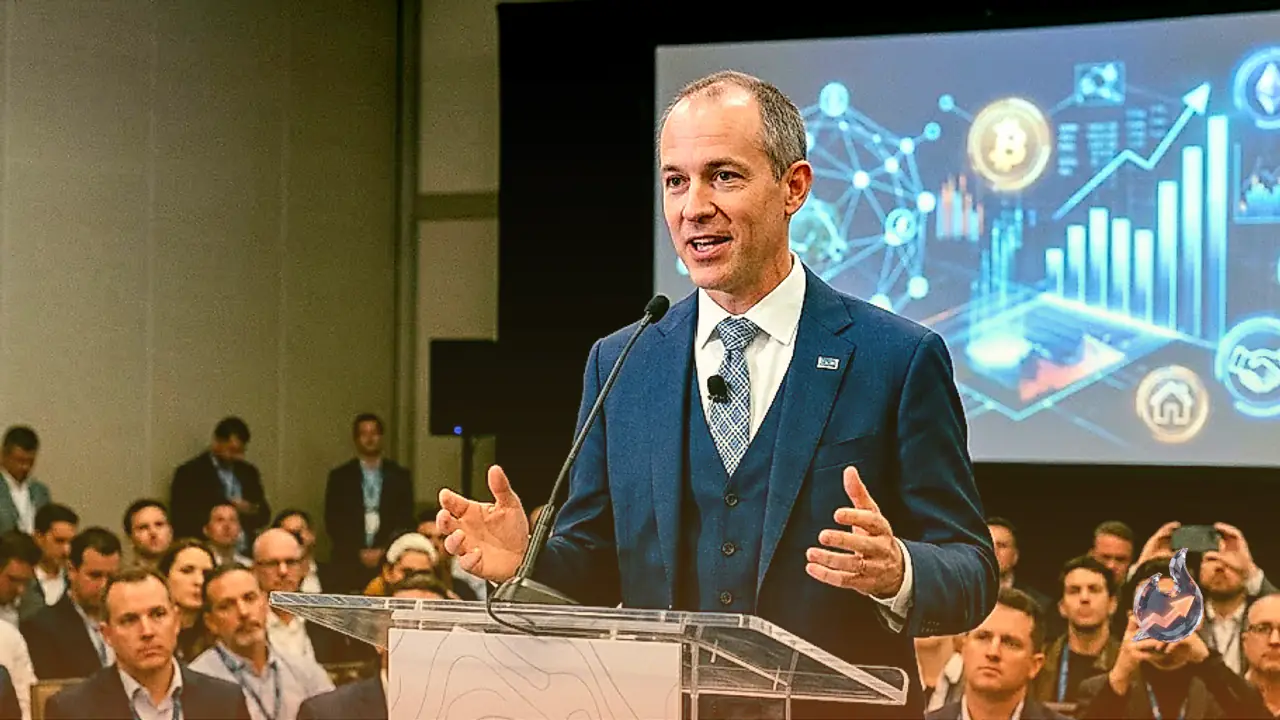

























A sudden and aggressive rally swept across global cryptocurrency markets as the US Treasury announced plans to double its long-dated debt buyback operation. The policy move sparked a dramatic short squeeze, triggering nearly $2 billion in total liquidations within hours. Futures and derivatives traders who had established leveraged bearish bets were forced to close their positions, creating a cascade of automated buy orders that propelled Bitcoin past the $68,000 threshold and revitalized broader investor sentiment.
US Treasury Debt Buyback Announcement Sparks Market Rebound
The catalyst behind the market-wide surge was the US Treasury Department's official decision to expand its bond buyback operations. Under the expanded framework, the Treasury will double its buybacks of long-term government debt instruments from September 4 through November 4. The department noted that further guidance regarding future buyback sizing will be released during the next Quarterly Refunding update, scheduled for November 4.
Following the public release of the buyback schedule, crypto markets experienced an immediate wave of forced position closures, with approximately $1.8 billion in liquidations materializing within a four-hour window. The prospect of enhanced liquidity in sovereign debt markets led to a swift decline in US Treasury yields. The yield on the benchmark 30-year Treasury bond fell 14 basis points to 5.197%, retreating from its multi-decade high of 5.337% set earlier on Tuesday. Meanwhile, the 10-year Treasury yield edged down from 4.677% to 4.657%, and the 5-year Note yield eased from 4.382% to 4.359%. This relief in sovereign yields provided much-needed macro tailwinds for risk assets, including digital currencies.
Bitcoin and Ethereum Experience Massive Short Liquidations
Bitcoin led the charge during the market rally, climbing more than 5% to breach $68,000, achieving its highest price point since June 2. Latest live market data shows Bitcoin trading around $69,585, representing a 7.58% gain from its previous closing price of $64,681. Prior to this breakout, Bitcoin had gained 2.9% over two days while testing its 50-day Exponential Moving Average (EMA) near $64,370. The rapid price escalation generated $1.14 billion in total Bitcoin liquidations, with short positions accounting for a dominant $1.11 billion of that total.
Ethereum mirrored the upward momentum, recording a 9% surge that pushed the leading altcoin above the $2,000 psychological barrier for the first time since June 1. ETH later consolidated above the $1,900 to $2,000 region. Total Ethereum liquidations reached $513.6 million, led by $464.8 million in wiped-out short bets. The massive liquidation of bearish leverage across both major assets injected fresh buying volume into derivative order books.
Altcoin Performance and Derivative Trends
Broader altcoins also participated in the recovery, with Solana (SOL) and Ripple (XRP) both advancing by approximately 6% over a 24-hour period. XRP reclaimed crucial support at the $1.00 level on Wednesday following mild selling pressure earlier in the week. Buyer interest re-emerged near the $0.99 support zone, aided by renewed capital inflows into spot Exchange-Traded Funds (ETFs).
Conversely, Pump.fun (PUMP) experienced a minor pullback, easing by 3% on Wednesday after posting a nearly 13% gain on Tuesday. Despite the slight spot price retreat, PUMP derivatives indicators signal sustained leverage demand, with Open Interest rising to a seven-month high of $258.62 million. Across the entire digital asset ecosystem, total crypto market capitalization expanded by 5% over 24 hours to reach $2.4 trillion.
Sentiment Shifts to Neutral Alongside Key Technical Indicators
The combined effect of falling bond yields and massive short liquidations significantly enhanced market sentiment. The Crypto Fear and Greed Index rose from 41 (nearing Fear territory) up to 51, entering Neutral territory for the first time since mid-May.
From a technical standpoint, professional multi-horizon analysis outlines critical levels for market participants. In the short-term (1 to 6 weeks), Bitcoin continues to trade within a horizontal channel, accompanied by an unfolding head-and-shoulders structure. A decisive break below key support around $63,193 on elevated volume could signal further downside risks. However, the 14-day Relative Strength Index (RSI) has climbed to 74, indicating strong bullish momentum alongside overbought conditions. The MACD histogram stands at 391.33, reinforcing the bullish trajectory.
Over the medium term (1 to 6 months), while Bitcoin remains within a descending channel, an inverse head-and-shoulders pattern is developing. A sustained breakout above the $66,259 resistance level accompanied by expanding volume would confirm a broader bullish reversal. Key moving averages show the 20-day Exponential Moving Average (EMA) at $64,431, the 50-day EMA at $64,526, and the 200-day EMA at $72,709. Technical pivot calculations establish immediate pivot support at $67,790, with upside resistance levels at R1 ($71,459) and R2 ($73,333), and downside support levels at S1 ($65,916) and S2 ($62,247). Bitcoin's 52-week trading range spans between $57,748 and $97,861.