
























The Australian Dollar is facing severe selling pressure in international foreign exchange markets, extending its downward trajectory for a fifth consecutive trading session. Driven by a surge in US Dollar demand and a distinctly dovish tone from the Reserve Bank of Australia (RBA), the AUD/USD pair has dropped toward the mid-0.6700s, touching its lowest level since January 22. This decline marks the seventh negative session out of the last eight for the Australian currency.
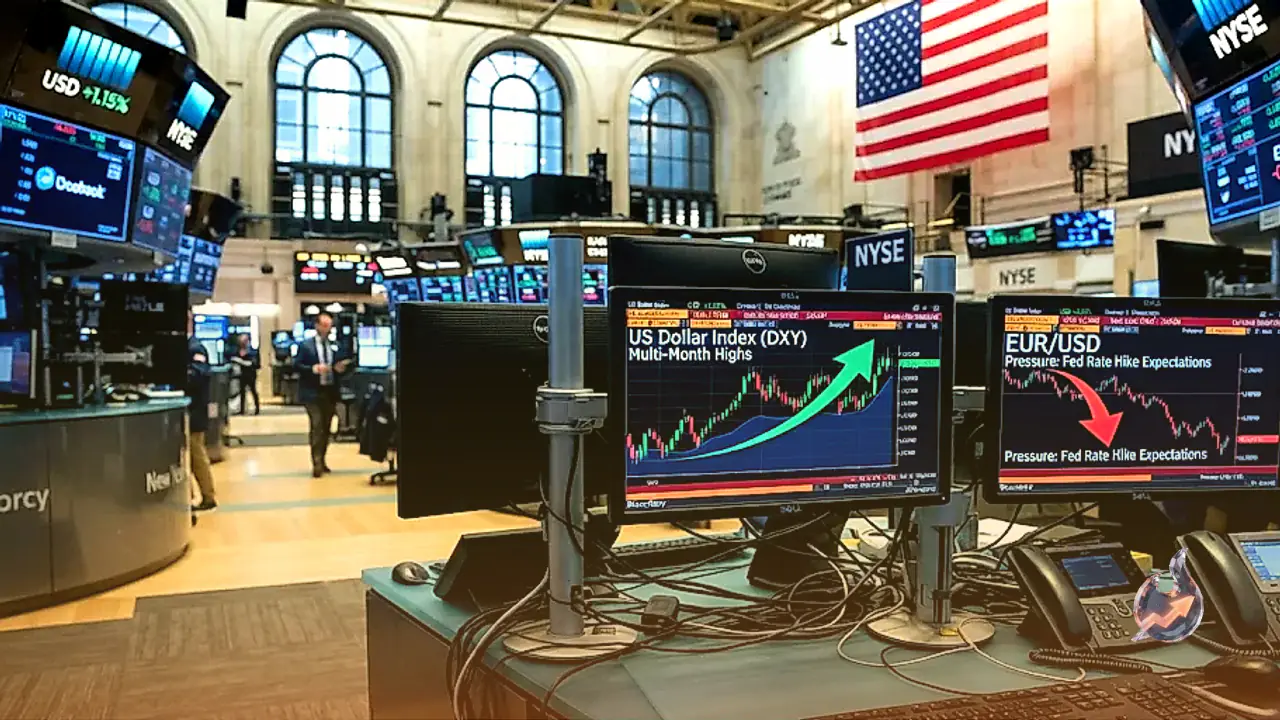
A combination of firming Federal Reserve rate hike expectations and escalating geopolitical tensions in the Middle East has pushed the US Dollar index to fresh highs last seen in April 2025. Conversely, weakening economic momentum in China—Australia's premier trading partner—has compounded headwinds for commodity-linked currencies, consolidating a strongly bearish outlook for the AUD/USD currency pair.
RBA Policy Shift and Weak Chinese Economic Indicators Weaken Australian Dollar
The Australian Dollar's relative underperformance stems largely from the Reserve Bank of Australia's recent monetary policy decision. Although the RBA delivered an interest rate hike with a 6-3 vote split among board members, policymakers explicitly removed earlier language signaling further monetary tightening. This subtle shift toward a dovish posture convinced currency traders that Australia's rate-hiking cycle may have reached its peak.
Adding to the Aussie's woes, fresh macroeconomic data released out of Beijing showed disappointing performance in China's October Retail Sales and Industrial Production. Because Australia's export economy relies heavily on Chinese demand for raw materials like iron ore and coal, softening industrial output in China immediately translates to reduced appetite for the Australian currency. Over the past seven days, the Australian Dollar managed to gain only against the Swiss Franc among major currency counterparts.
Technical Breakdown: 200-Day Moving Average Lost and RSI Signals Oversold Conditions
From a technical analysis standpoint, the AUD/USD pair remains locked in a strong bearish trend following its failure to hold above the critical 200-day Simple Moving Average (SMA) located near 0.7052. The subsequent breakdown below the psychological support level at 0.6900 further accelerated selling momentum.
Live market feeds show AUD/USD trading around 0.6757, down 0.73 percent from its previous close of 0.6807. The 14-day Relative Strength Index (RSI) has dipped to 28, moving deep into oversold territory. While an oversold RSI frequently cautions that a short-term technical bounce or consolidation phase could occur, the broader trend structure remains firmly downward. Key technical parameters show the 20-day Exponential Moving Average (EMA) at 0.6927 and the 50-day EMA at 0.6986, with immediate daily support levels pegged at S1 0.6744 and S2 0.6731.
Safe-Haven Dollar Strengths Against Japanese Yen Amid Unexpected Japan GDP Contraction
In other major currency pairs, USD/JPY fluctuated around the 159.50 level. Japan's economic data surprised markets to the downside as official figures revealed that the Japanese economy contracted by 0.1 percent quarter-on-quarter in Q3. Despite this unexpected economic contraction, the Japanese Yen found modest underlying support from market expectations of potential currency intervention by government authorities.
However, the greenback's broader strength, supported by steady Fed rate hike projections and multi-month high US yields, continues to keep upside momentum in USD/JPY intact.
Precious Metals and Crypto Suffer: Gold Drops Below $3,850 While Bitcoin Struggles Under ETF Outflows
The persistent strength of the US Dollar and elevated Treasury yields reverberated across commodity and digital asset markets. Gold prices extended their decline, breaking below $3,850 per ounce to reach a fresh low since early October 2025. Rising interest rate expectations have diminished the non-yielding metal's appeal, overriding traditional safe-haven demand arising from US-Iran geopolitical friction.
In cryptocurrency markets, Bitcoin struggled to regain lost ground, trading below $65,200 after plummeting to a low of $62,006 last week—its lowest level since mid-July. Institutional capital flight remains a primary catalyst, with spot Bitcoin Exchange Traded Funds (ETFs) registering a second consecutive week of outflows exceeding one billion dollars.
Wall Street Undercurrents: Treasury Yields Spike as Tech and Commodities Face Pressure
Although main US equity benchmark indexes managed to end the prior week higher, underlying market indicators painted a more turbulent picture. US Treasury yields experienced their sharpest weekly advance in more than two years as bond markets priced in persistent central bank tightening.
Simultaneously, technology bellwether Nvidia logged its worst weekly stock performance since the tariff-driven selloff of April 2025. Coupled with multi-month lows in gold prices, these signals underscore growing risk aversion among global investors navigating tighter liquidity conditions.