























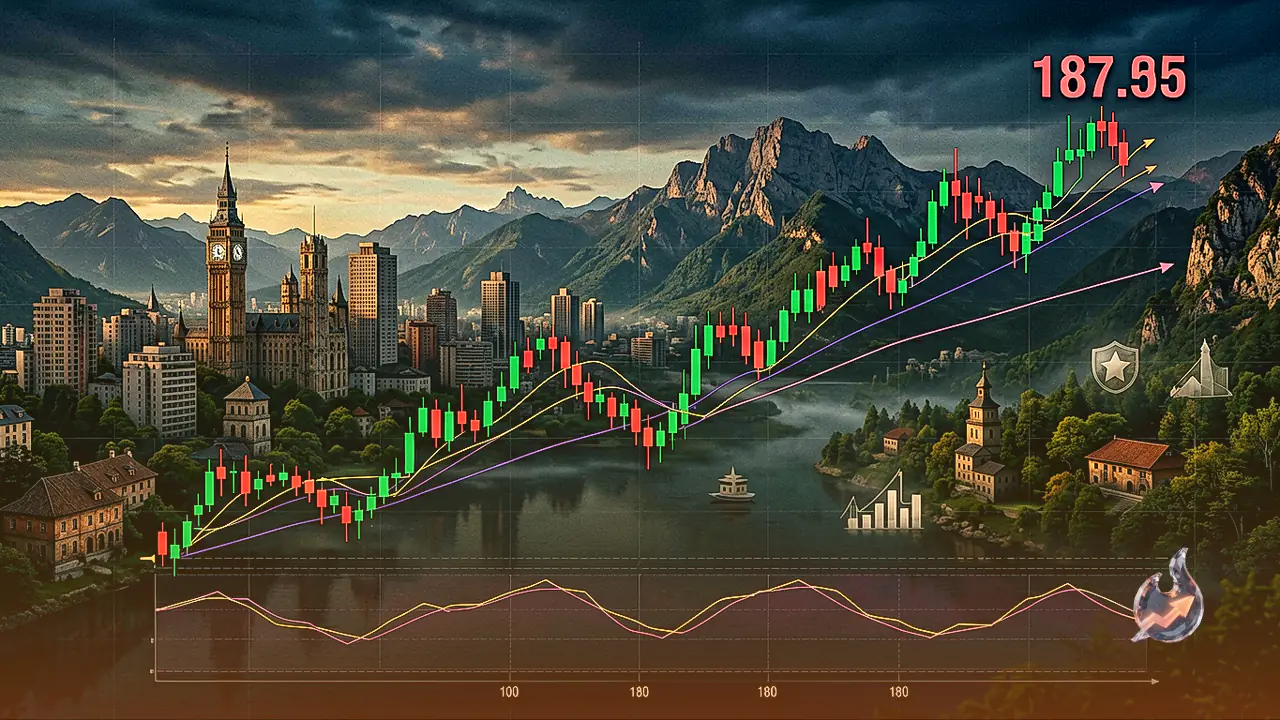

The EUR/JPY currency cross continues to demonstrate underlying strength, consolidating above the critical 185.50 mark during Asian trading hours on Thursday. Spot prices traded in the vicinity of 185.70 to 185.74, recovering ground after experiencing brief, limited losses in the prior session. Technical analysis on the daily timeframe confirms that the cross remains comfortably embedded within an ascending channel structure, underscoring an intact bullish bias. With prices hovering above key exponential moving averages, dip-buyers appear positioned to defend immediate support zones while testing broader resistance levels.
Technical Indicators and Moving Average Confluence
A granular look at the daily chart reveals that the EUR/JPY pair holds firmly above its 9-period Exponential Moving Average (EMA) at 185.30 and the 50-period EMA at 184.77. Further down, the 200-period EMA rests at 182.90, maintaining a established golden cross formation where the 50-period EMA trades above the 200-period EMA, validating the macro uptrend. The 14-day Relative Strength Index (RSI) stands at 58.39 to 60, reflecting robust upward momentum without entering overbought territory. This technical posture indicates ample room for potential upside expansion before momentum encounters exhaustion.
Complementing the RSI, the Moving Average Convergence Divergence (MACD) indicator displays a bullish readout at 0.28 against a signal line of -0.00, accompanied by a positive histogram of 0.29. Bollinger Bands show the upper and lower envelopes expanding between 181.07 and 186.81, with the 20-period midline anchored at 183.94. The Average Directional Index (ADX) sits at 19, suggesting that while the trend remains positive, directional momentum is accumulating steadily rather than overheating.
Crucial Upside Targets and Downside Support Boundaries
Should buyers maintain control, the immediate upside target for EUR/JPY lies near the all-time high of 187.95 recorded on April 17. Beyond that historical threshold, the upper boundary of the daily ascending channel around 188.50 stands as the secondary resistance target. Intraday pivot calculations highlight immediate resistance levels at R1 185.85 and R2 185.97, with the central pivot established at 185.66.
On the downside, initial technical protection is located along the ascending channel's lower boundary at 185.60, backed closely by intraday support levels at S1 185.54 and S2 185.35. A deeper pullback brings the 9-day EMA at 185.30 and the 50-day EMA at 184.77 into focus, forming a strong confluence zone. With the Average True Range (ATR) measuring 0.96, market participants note sufficient volatility buffer around these handles. A decisive breakdown below this confluence support area could void the bullish setup, exposing the pair to a potential retracement toward its nine-month trough of 179.37 registered on August 3.
Cross-Currency Dynamics and Global FX Movements
Across the broader foreign exchange landscape, the Euro demonstrated notable resilience, emerging as the strongest performer against the British Pound in daily cross-currency comparisons. Conversely, the GBP/USD pair resumed its downward trajectory, undoing Tuesday's recovery effort and dropping below 1.3600 on Wednesday. This retreat in Cable stemmed from broad-based US Dollar strength as traders weighed economic data against geopolitical developments.
EUR/USD also encountered selling pressure, pulling back toward the mid-1.1600 range ahead of the Asian session opening. Solid gains in the Greenback, driven by persistent inflation concerns and caution ahead of central bank events, capped Euro gains against the buck. Market participants now turn their focus to the European Central Bank's upcoming publication of its meeting accounts on Thursday.
Central Bank Signals, US Inflation, and Macro Environment
Macroeconomic sentiment remains heavily influenced by expectations surrounding the Federal Reserve. Fed Chair Kevin Warsh is scheduled to deliver his inaugural Jackson Hole speech on Friday, with market observers watching for guidance regarding interest rate trajectories beyond the September policy gathering. Data released on Wednesday showed the US July Personal Consumption Expenditures (PCE) Price Index rising faster than expected, signaling that inflation pressure remains sticky.
In Asian currency markets, the South Korean Won posted gains against the Greenback, causing USD/KRW to slip 0.3% toward 1,380 during Thursday's trading session. The pair retested its 11-month low as sequential interest rate increases by the Bank of Korea provided underlying support to the domestic currency.
Cryptocurrency Markets and Asset Class Performance
Risk appetite in alternative asset markets remained firm alongside forex movements. Bitcoin (BTC) maintained its position above $78,000 on Thursday, displaying steady institutional interest despite elevated US inflation figures. Within the altcoin space, SPX6900 (SPX) and VeChain (VET) led short-term market advances, registering double-digit percentage gains over the preceding 24 hours.