

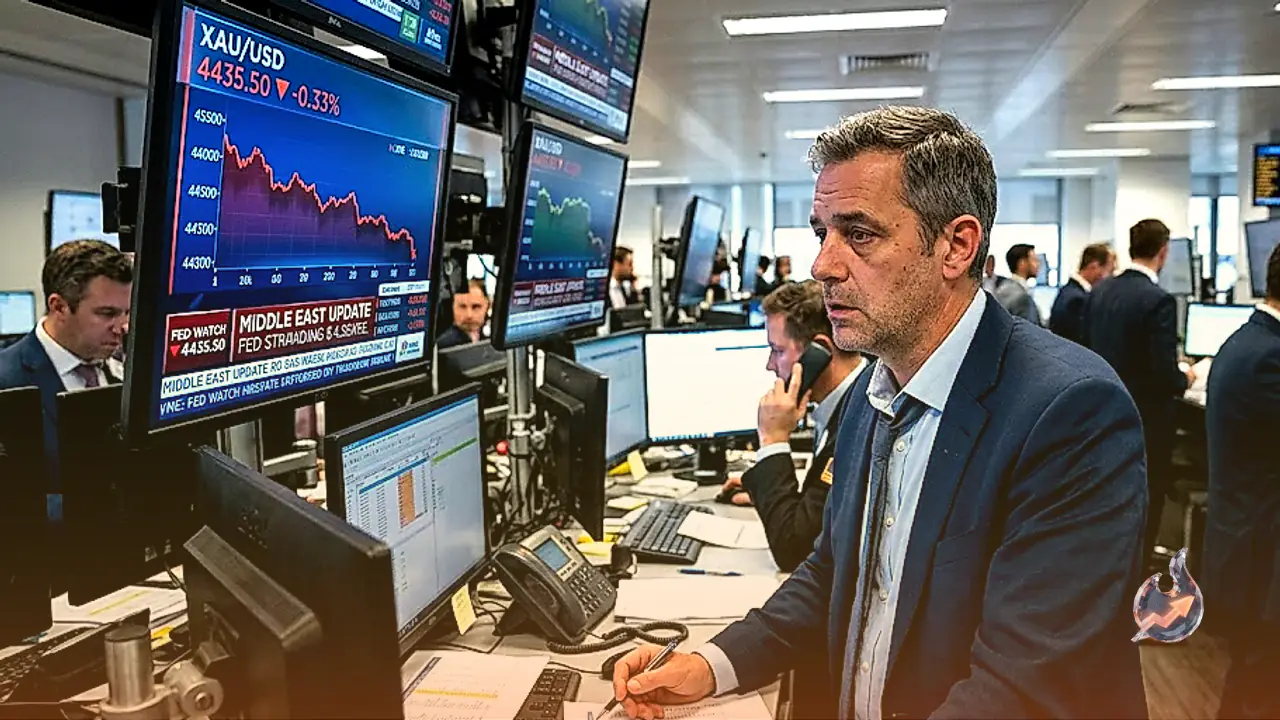





















Gold prices drifted lower during Tuesday's early Asian session, slipping to trade around the $4,445 mark. Renewed geopolitical tensions in the Middle East have reignited inflation worries and increased market bets that the Federal Reserve might raise interest rates as early as September. Traders are pricing in a significant probability of a rate increase following strong statements from central bank officials regarding price stability.
Geopolitical Escalation and Middle East Developments
US President Donald Trump on Monday threatened a forceful strike against Iran following an exchange of fire between Washington and Tehran for the first time in a month. Meanwhile, Iran's Revolutionary Guard Corps stated it had targeted US military installations in the region in response to recent American strikes. The US military had previously announced an action targeting Iranian rocket launchers on Larak Island in the Strait of Hormuz, heightening regional volatility.
Federal Reserve Stance and Inflation Pressures
Market participants are reassessing the monetary policy outlook following hawkish remarks from Fed Chair Kevin Warsh, combined with a sharp surge in oil prices that has further fueled inflation concerns. During the annual Jackson Hole symposium, Kevin Warsh reaffirmed the central bank's commitment to its inflation target and signaled that policymakers are not yet confident that price pressures are subsiding sufficiently. GAMA Asset Management Global Macro Portfolio Manager Rajeev De Mello noted that this shift toward a more hawkish posture came as a surprise to many investors, suggesting that short-term headwinds for gold may persist. According to the CME FedWatch tool, traders are pricing in over 65.4% odds of a rate hike at the September meeting, up sharply from around 39.9% prior to the speech.
Policy Tracking and Technical Indicators
The policy tone remained decidedly firm, with the speech tracker score registering 7.4 compared to the historical average of 6.5, underscoring heightened vigilance on price stability despite solid economic growth and stable labor markets. The emphasis on ensuring underlying inflation returns securely to the 2% target suggests openness to further policy tightening if inflation metrics fail to improve. On the daily chart, XAU/USD maintains a constructive near-term bias, holding above the 100-day Moving Average at $4,370.48 and the Bollinger Bands' 20-day simple moving average center line at $4,430.23. The Relative Strength Index (RSI) at 54 keeps momentum in neutral-to-positive territory, indicating persistent bullish support without entering overextended conditions.
Broader Market Movements and Commodity Dynamics
In the broader foreign exchange and commodity markets, the Greenback's movements continued to influence risk assets, with EUR/USD managing to advance past the 1.1600 hurdle amid downside momentum in the US Dollar. Meanwhile, energy markets exhibited distinct pressures as the US diesel crack spread surged above $100 per barrel for the first time, reaching an intraday record high of just over $102.00, highlighting underlying supply cost pressures that continue to feed into broader economic inflation metrics.