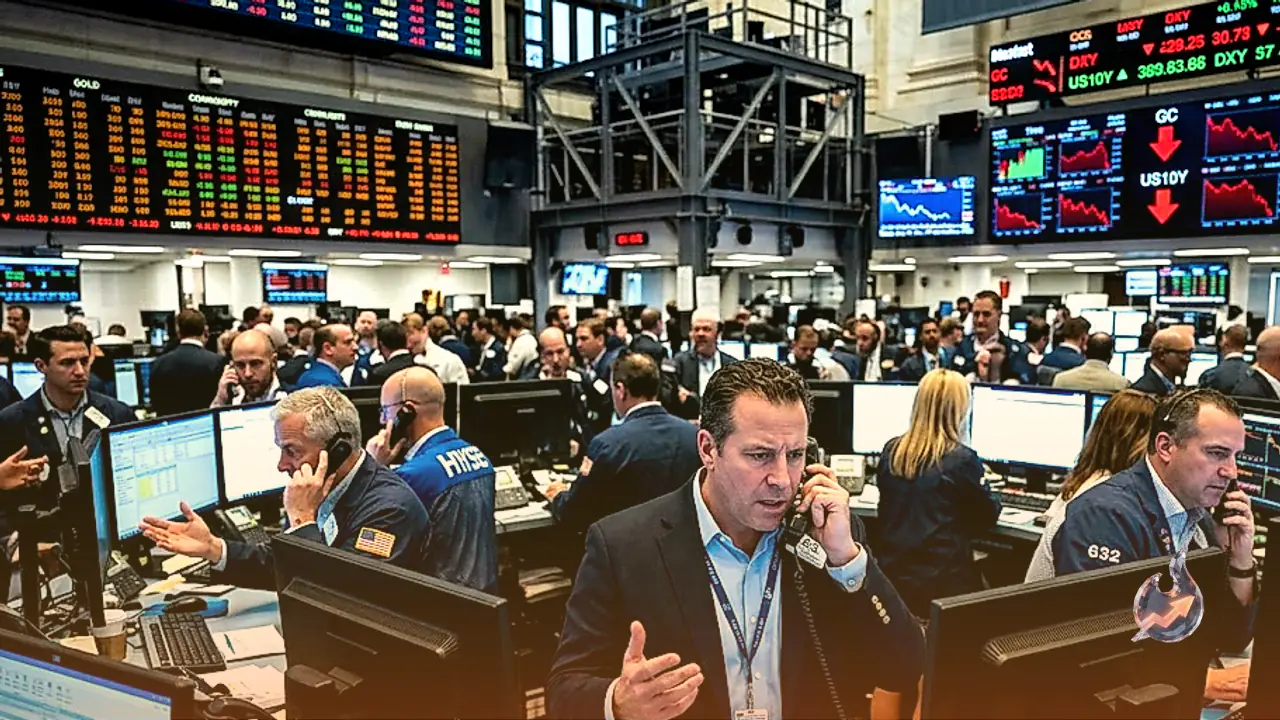

























The Reserve Bank of India has increased its primary policy repo rate by 25 basis points to 5.5%, marking the first benchmark borrowing rate hike undertaken by the monetary authority since February 2023. Along with the increase in borrowing costs, the central bank formally transitioned its overall monetary policy stance from 'neutral' to 'calibrated tightening'. Despite the hawkish pivot and direct policy adjustment, the Indian Rupee exhibited a subdued reaction in foreign exchange trading against the US Dollar, maintaining a steady posture near 96.37 in the immediate aftermath of the announcement.
According to live market data, the USD/INR currency pair traded at 96.53, advancing 0.19% from the prior closing mark of 96.34. Over the past 52-week period, the exchange rate has moved within an envelope of 85.86 to 97.05, while turnover matched 1.00 times its 20-day average. Technical indicators show a 14-period Relative Strength Index (RSI) at 61, alongside a Moving Average Convergence Divergence (MACD) reading of 0.26 against a signal line of 0.20, generating a positive histogram value of 0.06. Moving averages display the 20-day Exponential Moving Average (EMA) at 95.92, the 50-day EMA at 95.64, and the 200-day EMA at 93.65, whereas the 50-day Simple Moving Average (SMA) stands at 95.49 and the 200-day SMA at 93.98. The sustained posture of the 50-day EMA above the 200-day EMA confirms a golden cross within an enduring upward trend. Bollinger Bands spanning 95.18 to 96.63 with a 95.90 centerline reflect price containment within standard deviations. Trend strength remains reinforced by an Average Directional Index (ADX) of 27, while fast Stochastic lines read 100 against a 96 signal line, accompanied by an Average True Range (ATR) of 0.51. Strategic price pivots place the central pivot at 96.46, upside resistance barriers at R1 96.60 and R2 96.67, and initial downside supports at S1 96.39 and S2 96.25, alongside 20-day structural support near 94.49 and resistance near 96.54.
Dollar Regains Traction as Treasury Yields Advance
In the broader international currency landscape, the US Dollar recouped lost ground following a modest downward correction in the preceding trading session. During Asian trading hours, the US Dollar Index (DXY), which monitors the currency against a basket of six leading international peers, gained 0.18% to trade in the vicinity of 102.00. An upward push in US government bond yields helped draw renewed interest from dip-buyers, with underlying geopolitical tensions providing further structural support to the Greenback.
Global market participants are directing their focus toward the release of the upcoming FOMC Minutes to gain clearer perspective on the path of Federal Reserve interest rates. This cautious sentiment among investors has helped the US Dollar establish firm ground across cross-currency channels, counterbalancing rate tightening efforts initiated by regional central banks.
Divergence Across Major Currency Pairs
The subdued movement in the Indian currency occurred alongside broader foreign exchange trends across the Asian trading session. The Australian Dollar struggled to preserve its recent recovery trajectory against the US Dollar (AUD/USD), softening below the 0.7000 threshold with a discernible negative bias on Wednesday. Although domestic market expectations pointed toward policy firmness from the Reserve Bank of Australia, the dual impact of surging US Treasury yields and safe-haven Dollar demand capped upside momentum for the pair.
Meanwhile, the US Dollar held firm against the Japanese Yen (USD/JPY), lingering close to a one-and-a-half-week peak near 158.50 in Wednesday's Asian trade. Traders showed reluctance to push positions aggressively past the 200-day SMA barrier ahead of the FOMC Minutes. A pickup in US sovereign bond yields combined with dovish commentary from Bank of Japan policymakers provided sustained tailwinds to the pair in the face of ongoing geopolitical developments.
Precious Metals Retreat and European Central Bank Dilemma
Gold prices relinquished earlier recovery gains during Asian trading, encountering downward friction near $4,150. The commodity faced headwinds as the US Dollar advanced concurrently with crude oil prices and rising US Treasury yields leading into the release of the Federal Reserve minutes. From a near-term charting standpoint, bullion continues to trade within an environment where price advances attract selling interest.
In Europe, the European Central Bank is grappling with an intricate monetary policy puzzle. While an inflation print running at nearly twice the official target would conventionally warrant an immediate interest rate increase, current market realities have complicated that approach. Sovereign debt markets have already generated a significant portion of effective financial tightening independently, confronting policymakers with difficult tradeoffs regarding economic stability and price control measures.