























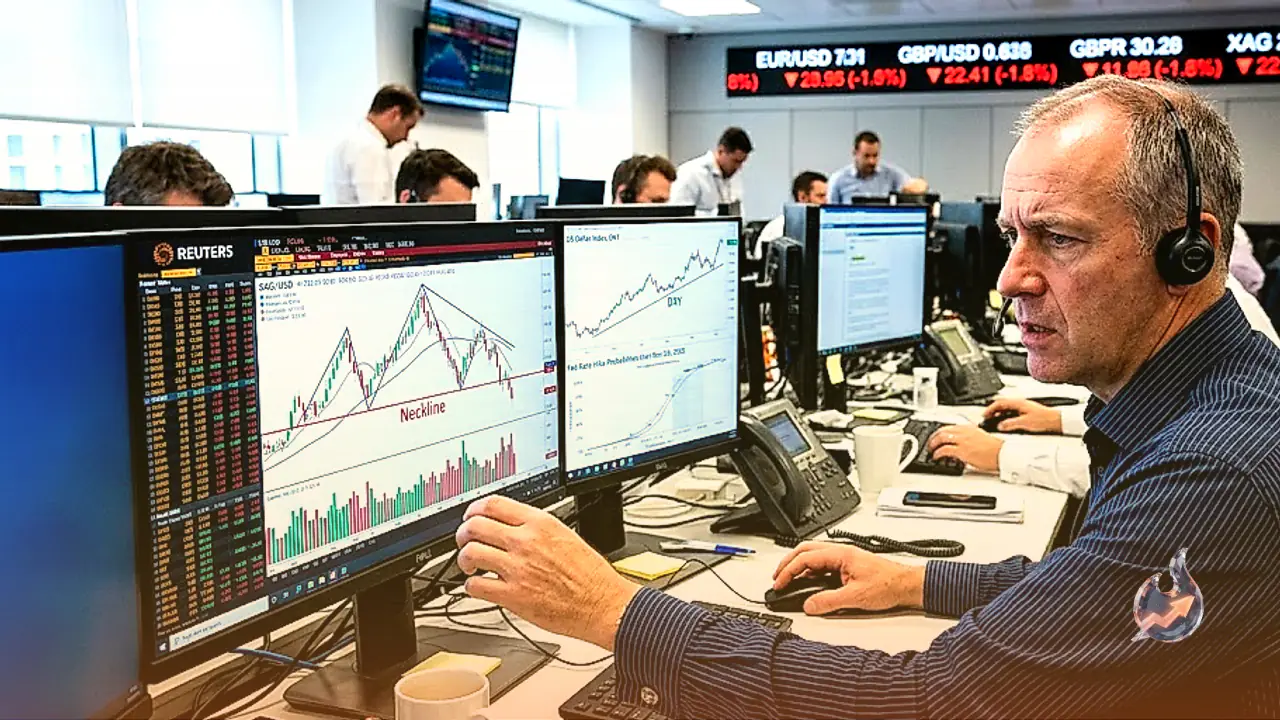

Global financial markets opened the week with heightened volatility as investors maintained a cautious stance ahead of the Federal Reserve's upcoming monetary policy meeting. This caution has significantly impacted precious metals, with Silver experiencing notable downward pressure. According to live market data, Silver (SI=F) is currently trading down 1.84% at $63.37 per ounce, following a previous close of $64.55. Trading volume during this downward move has surged to 7.68 times the 20-day average, indicating intense market participation and aggressive positioning from both retail and institutional traders.
Monetary Policy Uncertainty and Inflation Metrics Weigh on Sentiment
The primary driver behind the current sell-off in non-yielding assets is the Federal Reserve's scheduled monetary policy meeting on September 15-16. According to the CME FedWatch Tool, market participants are pricing in an 86% probability of a 25-basis-point interest rate increase. Because precious metals like Silver do not offer yield or interest, higher interest rates raise the opportunity cost of holding them, prompting investors to seek higher-yielding alternatives such as government bonds.
This hawkish outlook has been further cemented by recent US economic data. The Consumer Price Index (CPI) for August rose by 0.4% month-on-month, while core inflation edged up by 0.3%. Additionally, robust Producer Price Index (PPI) reports and rising crude oil prices, fueled by intensifying geopolitical tensions in the Middle East, have compounded inflation fears. This macro environment has kept the US Dollar and Treasury yields elevated, directly limiting any immediate upside potential for commodity prices.
Technical Setups Signal Bearish Dominance with a 'Death Cross'
From a technical standpoint, Silver's daily chart shows a highly bearish setup. The metal is currently testing the critical neckline of a head-and-shoulders chart pattern, which aligns closely with its 50-day Simple Moving Average (SMA) at $62.57 (with historical references placing it near $62). A daily close below this critical threshold would validate the bearish reversal pattern, potentially triggering a deeper sell-off across the board.
Adding to the bearish momentum is a newly formed 'Death Cross' on the exponential moving averages, where the 50-day EMA at $64.99 has crossed below the 200-day EMA at $66.32. This signal is traditionally viewed by technical analysts as a precursor to sustained long-term downward trends. The 20-day EMA also sits at $65.44, while the Bollinger Bands showcase a range between the lower band at $62.86 and the upper band at $70.13, centered around a middle band of $66.50.
Momentum indicators are leaning heavily to the downside. The 14-day Relative Strength Index (RSI) is currently hovering at 45, pointing to neutral-to-bearish sentiment. Meanwhile, the Moving Average Convergence Divergence (MACD) indicator is firmly bearish, with the MACD line at 0.35 and the signal line at 0.92, generating a red histogram reading of -0.57. While the Stochastic Oscillator indicates oversold conditions with the fast line at 7 and the signal line at 12, the Average Directional Index (ADX) of 17 suggests that the current trend lacks strong directional strength and is currently in a weak, range-bound phase.
Critical Support and Resistance Zones for Traders
Market participants should closely monitor several pivotal levels. If the immediate neckline support holds, Silver could attempt a technical rebound toward its 100-day SMA near $66. A clean breakthrough above this resistance would alleviate immediate selling pressure, turning focus toward the psychological resistance at $70 and eventually the 200-day SMA at $72.28. The 52-week high for Silver stands at $121.30.
Conversely, if the sellers maintain control and push prices below the 50-day SMA, immediate support is expected at S1 ($62.45) and S2 ($61.53). A breach of these levels would open the gates for a test of the $60 psychological support level, with $55 acting as the subsequent target. The 52-week low for the metal is recorded at $41.49. In light of the current daily volatility, traders are advised to maintain a stop-loss buffer of approximately $1.97, guided by the Average True Range (ATR) indicator. The daily pivot point is currently positioned at $63.72, with resistance levels R1 and R2 standing at $64.63 and $65.90, respectively.
Silver's Dual Dynamics: Industrial Utility vs. Safe-Haven Asset
Silver is highly unique due to its dual identity as both a precious financial asset and a crucial industrial commodity. While often overshadowed by Gold, Silver remains a popular choice for portfolio diversification, acting as a physical hedge during periods of persistent inflation via coins, bullion, and Exchange Traded Funds (ETFs) that track international market prices.
On the industrial side, Silver's exceptional electrical conductivity, which exceeds that of both Copper and Gold, makes it indispensable in the manufacture of electronics, semiconductors, and solar panels. Consequently, economic health in major industrial powerhouses heavily influences its valuation. The United States and China utilize massive volumes of Silver in their manufacturing sectors, while India's consumer base drives significant demand for silver jewelry. A contraction in these major economies usually depresses silver prices, although its safe-haven status during acute crises can occasionally offset industrial losses.
Broad Market Context: Currency and Cryptocurrency Trends
The broader financial landscape also mirrored the impact of a stronger US Dollar on Monday. In the foreign exchange market, the AUD/USD pair slumped to a one-and-a-half-week low near 0.7140 before trading slightly above mid-0.7100s, marking a daily loss of about 0.25%. Concurrently, the USD/JPY pair found support, climbing toward the 154.00 handle during Asian trading and clawing back a portion of Friday's losses. However, the pair remains stuck within a well-defined weekly range and sits close to a seven-month low touched last Tuesday, as traders await key central bank events.
In contrast, the cryptocurrency markets showed resilient upward momentum. Bitcoin edged higher on Monday, trading near $77,884, while major altcoins followed its lead. Ethereum successfully defended its support level at $2,521, and Ripple held firm at the $1.38 mark. The diverging paths of digital assets and traditional industrial commodities highlight the complex interplay of macroeconomic forces currently driving global capital flows.