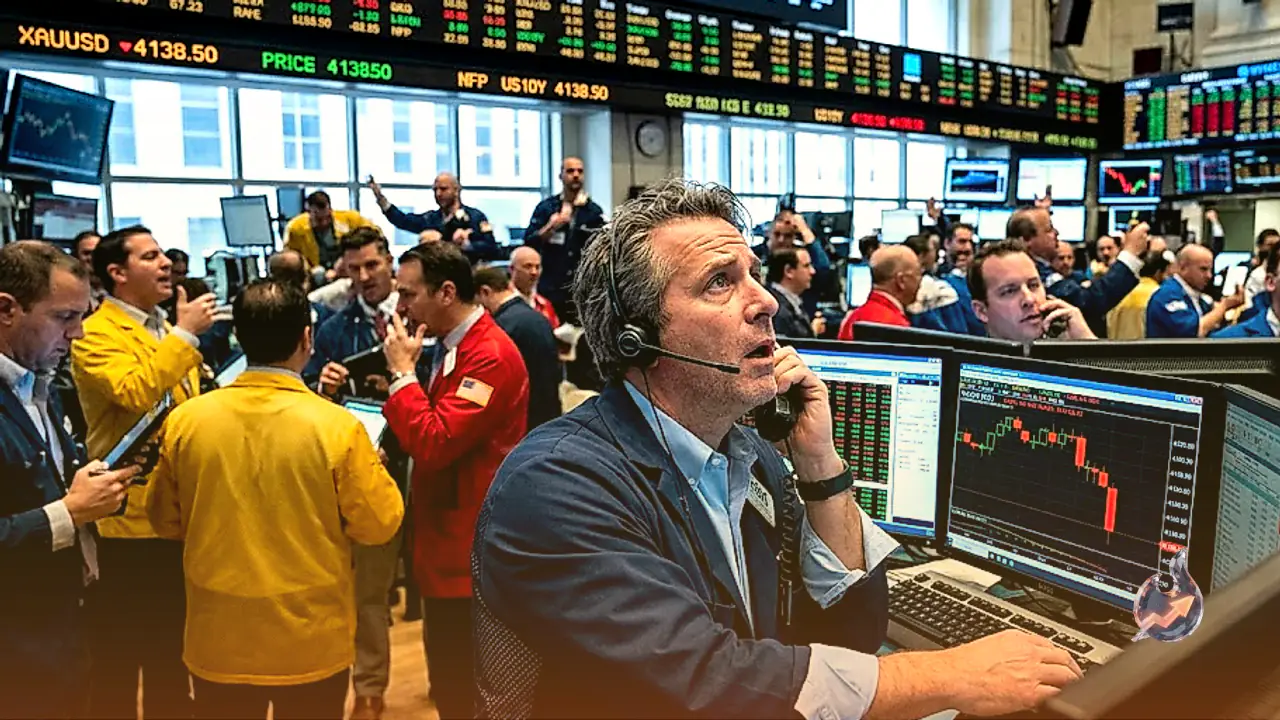

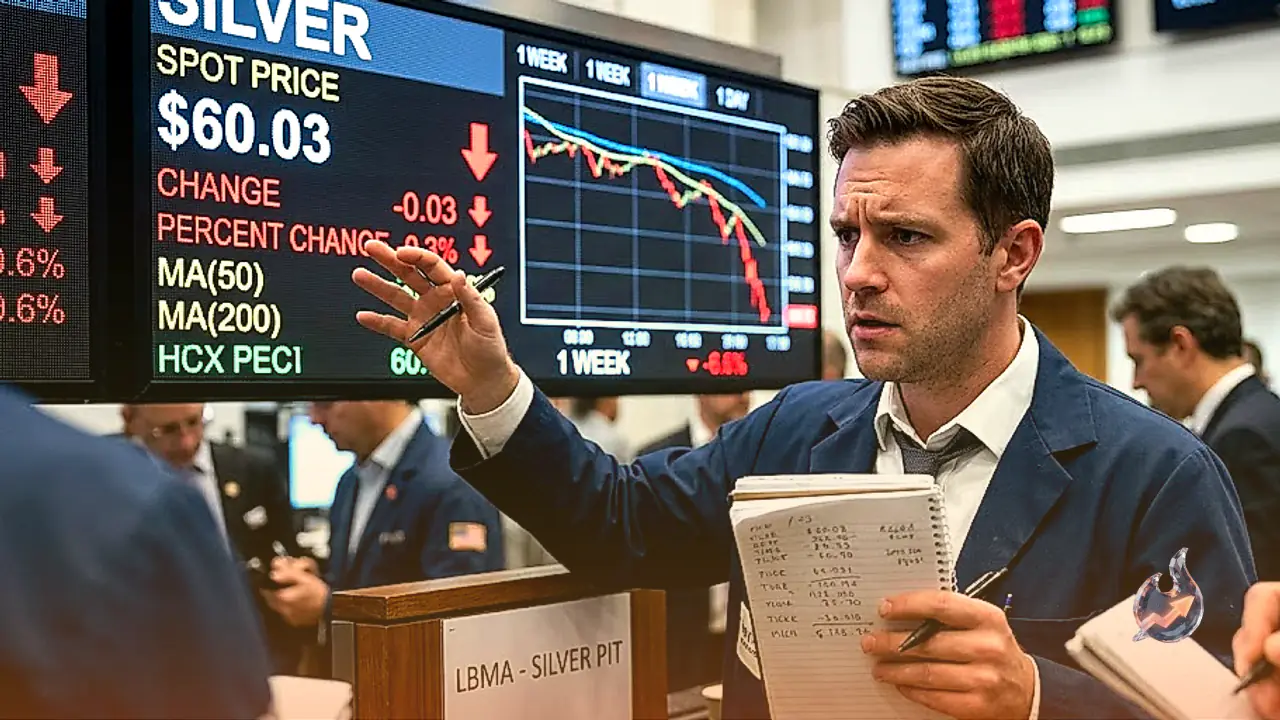




















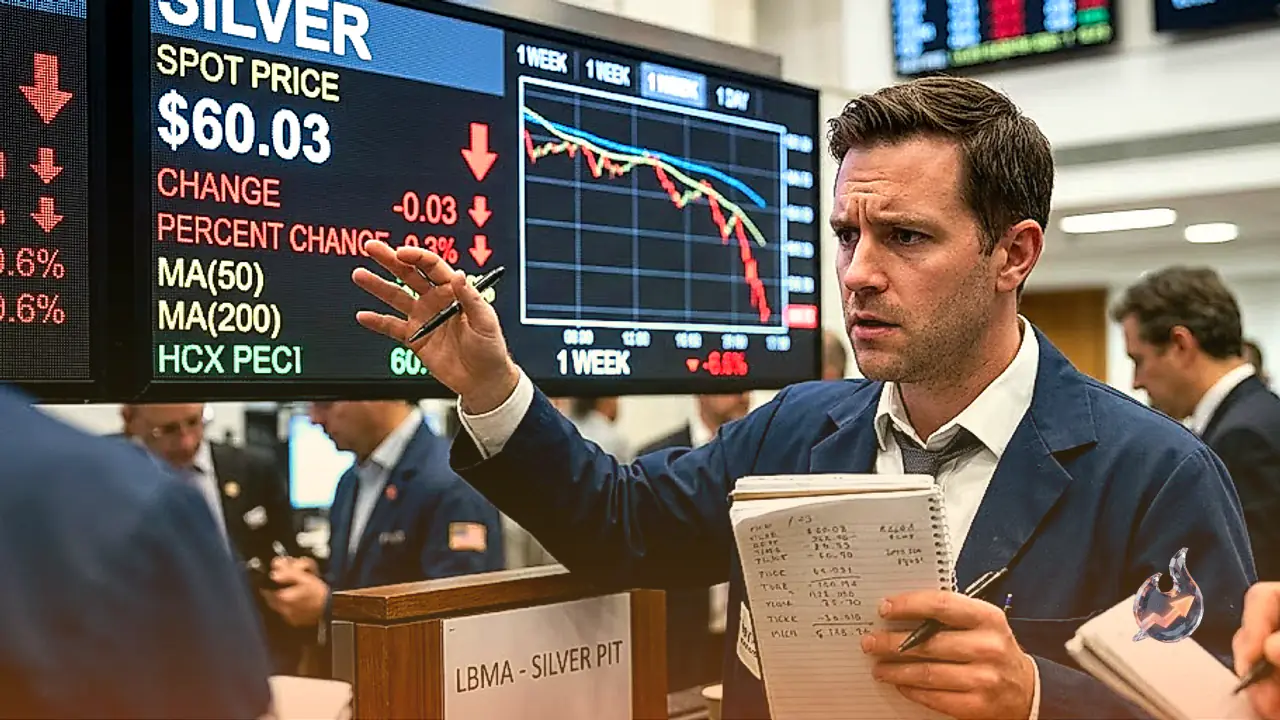

Selling pressure intensified across precious metals as Silver suffered a steep decline of more than 6% over the week, driving the white metal toward the critical $60.00 psychological support threshold. Technical charts reveal an entrenched bearish structure characterised by consecutive lower highs and lower lows beneath major moving averages. Trading near $60.71, the commodity remains under persistent downward momentum as sellers dictate market direction across near-term sessions.
Break Below Key Moving Averages Deepens Technical Weakness
The recent retreat dragged Silver below the confluence of its 50-day and 100-day Simple Moving Averages (SMAs), situated between $64.06 and $64.74. This zone now acts as formidable resistance against prospective recovery rallies. The technical landscape reflects sustained distribution, with price action respecting a lower-high, lower-low sequence that confirms market participants are using short-term rebounds to offload exposure.
Momentum indicators align with this negative trajectory. The 14-period Relative Strength Index (RSI) stands at 39, hovering well underneath the 50 neutral mark and edging toward oversold conditions. Meanwhile, the Moving Average Convergence Divergence (MACD) prints -1.11 against a signal line of -0.53, yielding a negative histogram of -0.58. Furthermore, the 50-day Exponential Moving Average (EMA50) at $64.17 sits below the 200-day Exponential Moving Average (EMA200) at $67.20, confirming a death cross configuration that solidifies a long-term downtrend across daily timeframes.
Critical Support Milestones and Potential Reversal Barriers
The immediate battleground for XAG/USD lies at the $60.00 support marker. A decisive breach of this floor opens the door for a continuation toward the August 3 low of the day at $56.57. Should downward velocity persist, the decline threatens to expose the year-to-date low of $54.77, marking a pivotal test within its 52-week trading span of $45.38 to $121.30. Live support levels also highlight initial cushions at S1 $59.64 and S2 $58.58, alongside 20-day support near $59.99.
Conversely, staging a valid bullish reversal requires substantial buying intervention. Buyers must first reclaim ground above the 50-day and 100-day SMAs before mounting an assault on the $65.00 barrier. Even a recovery toward that level leaves the broader downtrend intact unless market bulls decisively breach the August 28 cycle peak of $71.12. Immediate upside hurdles place the pivot at $61.05, followed by resistance levels at R1 $62.12 and R2 $63.52.
Silver's Dual Role in Portfolios and Valuation Drivers
Silver has historically functioned as both a store of value and a trusted transactional medium. While commanding less aggregate attention than Gold, market participants frequently deploy the metal to diversify investment holdings, capitalise on its intrinsic worth, or hedge against high inflation cycles. Investors gain exposure through physical holdings, such as minted coins and bullion bars, or through financial instruments like Exchange Traded Funds (ETFs) designed to mirror international spot valuations.
A spectrum of macro catalysts steers Silver valuations over time. Geopolitical unrest and recession anxieties periodically bolster demand for the metal under its safe-haven umbrella, albeit with less intensity than Gold. Being a yield-free asset, Silver typically gains traction during lower interest rate environments. Currency movements also exert heavy influence, as global contracts are denominated in United States Dollars (XAG/USD); a robust greenback suppresses prices, whereas Dollar weakness provides upside momentum. Supply considerations, including mining yields where Silver remains far more abundant than Gold, alongside industrial scrap recycling, further shape the fundamental balance.
Industrial Exposure and Influence of Key Global Economies
Beyond investment demand, Silver features extensive commercial deployment. Possessing superior electrical conductivity relative to copper and Gold, it represents an indispensable component within advanced electronics, microcircuits, and expanding solar energy technologies. Accelerating industrial output naturally stimulates consumption, while economic slowdowns curtail physical demand.
Macro conditions across the United States, China, and India play decisive roles in international pricing dynamics. The vast manufacturing sectors of the United States and China consume immense quantities of Silver across manufacturing chains. In contrast, Indian consumer appetite centered around jewellery, traditional gifting, and festive acquisitions provides a massive physical demand pillar. Investors also monitor the Gold/Silver ratio, which denotes the quantity of Silver ounces required to purchase an ounce of Gold. An elevated ratio frequently signals that Silver is undervalued or Gold is overstretched, while a depressed ratio indicates the inverse relationship.
Cross-Asset Movements Across Currencies and Commodities
Wider financial markets display considerable repositioning across foreign exchange and commodities. The US Dollar pulled back from 17-month peaks as traders booked profits prior to the Nonfarm Payrolls release. This allowed AUD/USD to rebound toward 0.6950 in Asian trade, bolstered by expectations of a potential November rate increase. USD/JPY retreated from weekly highs toward 158.00 following elevated Tokyo CPI data, while EUR/USD dropped to 1.1312, its lowest level since May 2025 and substantially below its January high of 1.2082.
In commodities, Gold retreated toward $4,180 per troy ounce after failing to sustain its advance beyond $4,200. Digital currencies displayed resilient performance as Bitcoin reclaimed levels above $86,000, Ethereum pushed beyond $2,700 despite resistance at $2,800, and Ripple hovered near $1.54. Global market attention now shifts toward energy market pressures, elevated bond yields, upcoming Federal Reserve minutes, and key international economic releases.