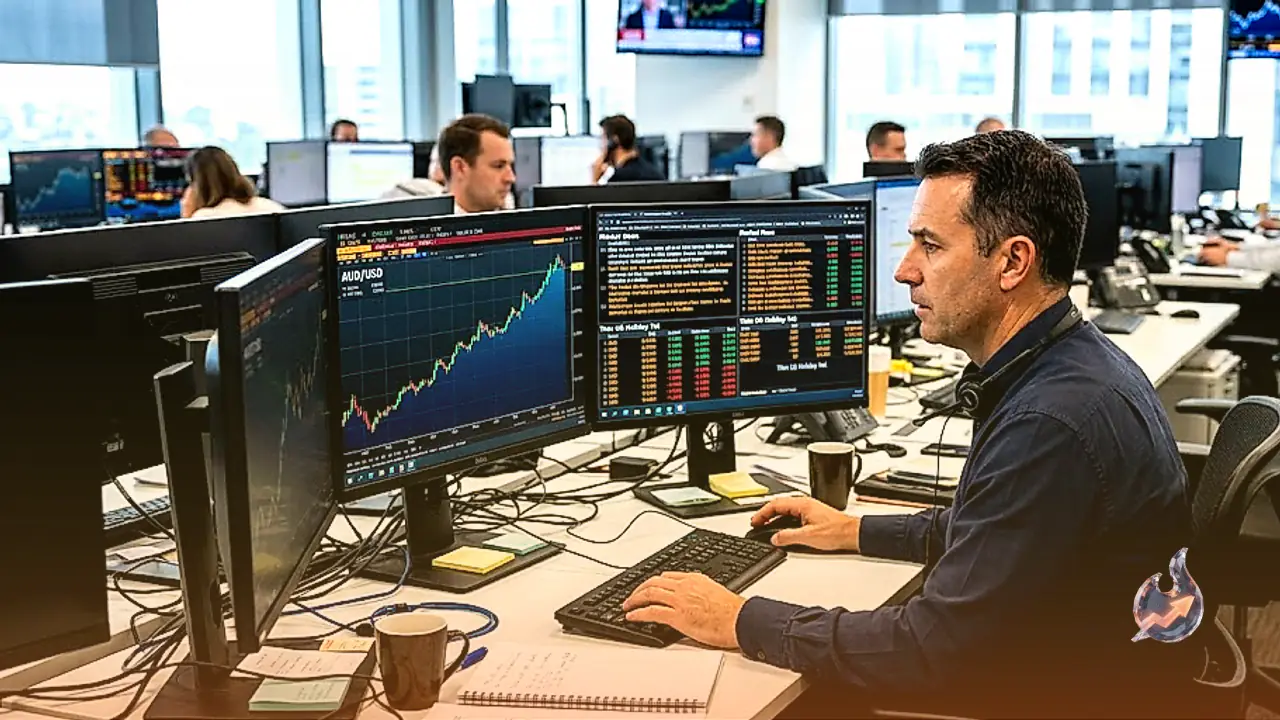



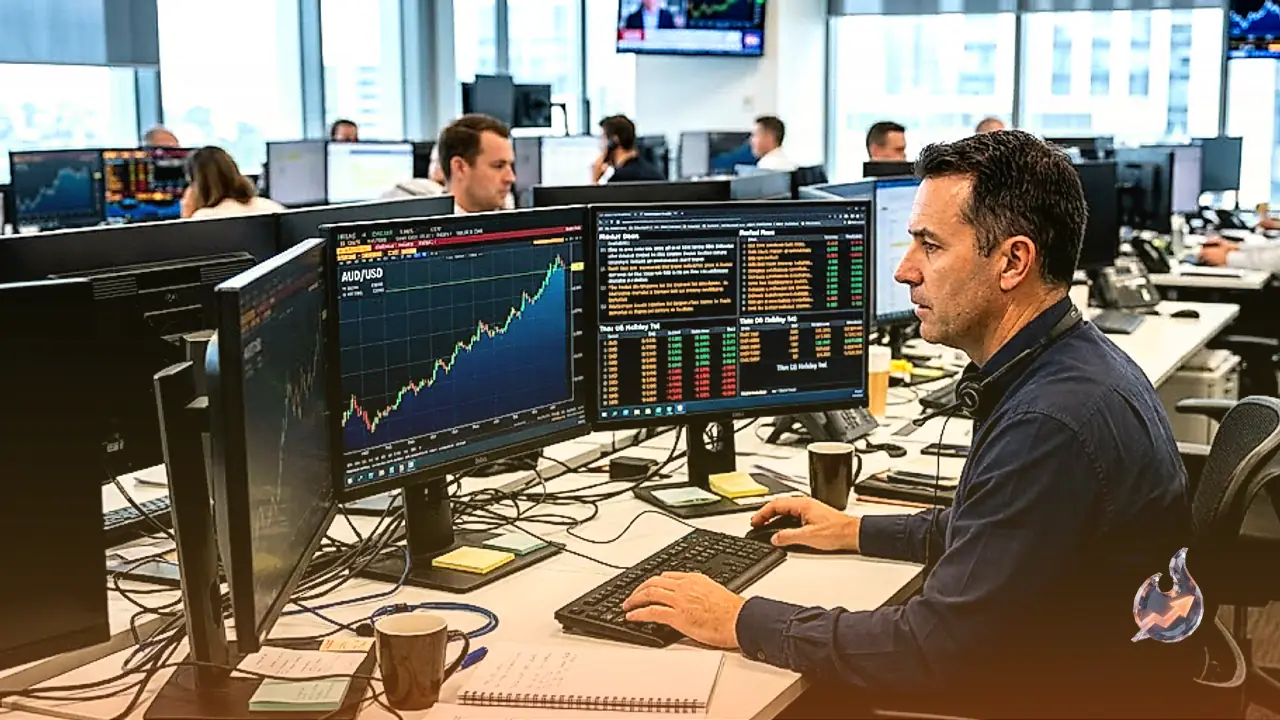




















The Thai baht's recent run of strength against the US dollar could be about to stall. Currency strategists at OCBC say several of the forces that had been driving the currency higher are now fading, opening the door to some consolidation in the sessions ahead.
What OCBC is flagging
OCBC's latest note points to a shift in the external environment as the main reason the rally may pause, with the currency's recent gains now running into more resistance as global conditions turn less favourable. The remark follows weeks in which the baht ranked among the better performing currencies in the region, helped by broad dollar weakness and firm gold prices.
A firmer dollar changes the equation
The main trigger, according to OCBC, was Friday's US non-farm payrolls report, which came in stronger than markets had expected. That reading pushed US Treasury yields higher and gave the dollar a lift, a combination that typically works against emerging Asian currencies like the baht. The stronger dollar also weighed on gold prices, and because the baht has tended to move in tandem with gold, given Thailand's standing as one of the world's larger gold trading hubs, the pullback in bullion has quietly stripped away another prop that had been supporting the currency.
Oil and the US-Iran flashpoint
A second, increasingly important headwind is oil. OCBC flagged that crude prices are becoming a bigger drag on the baht, particularly after tensions between the US and Iran resurfaced over the weekend, adding fresh upside risk to energy prices. "As a net energy importer, THB remains relatively exposed should oil stay elevated," the bank said, underscoring that the risk is tied directly to the country's import bill and trade balance rather than just sentiment. Because Thailand imports the bulk of its energy needs, a sustained rise in oil prices tends to widen that bill and weigh on the currency.
Momentum was already cooling before the close
Even before the weekend's developments, the technical picture had begun to soften. OCBC noted that USD/THB last closed at 32.94, with the mild bullish momentum seen earlier on the daily chart showing signs of fading, while the Relative Strength Index (RSI) had also fallen back. Both are classic early signs that a short-term trend is losing steam, even if no reversal has been confirmed yet.
Where USD/THB stands right now
Live pricing shows USD/THB trading at 32.85, down 0.21% from the previous close of 32.92, keeping the pair within its 52-week range of 30.82 to 33.86. Trading volume is running at roughly 1.00 times the 20-day average, suggesting no unusual rush of activity in either direction yet. The 14-day RSI now stands at 44, a neutral reading below the midpoint that lines up with OCBC's observation that momentum has cooled. The MACD line sits at -0.06 against a signal line of -0.08, leaving a histogram of 0.02 that points to an early bullish crossover, a signal some traders will watch closely for confirmation.
The moving averages show a mixed picture. The 20-day EMA sits at 33.00, the 50-day EMA at 33.05 and the 200-day EMA at 32.55, with the 50-day above the 200-day in what is known as a golden cross, a longer-term bullish setup. The 50-day and 200-day simple moving averages read 33.23 and 32.31 respectively. The Bollinger Bands run from 32.58 on the lower side to 33.34 on the upper side, with a midline of 32.96, and the pair is currently trading inside that band. The ADX reading of 20 points to a weak or range-bound trend, meaning the pair lacks a strong directional push right now. The Stochastic oscillator's fast line sits at 34 against a signal line of 39, while the Average True Range (ATR) of 0.23 gives a sense of the pair's daily volatility.
Levels to watch
On the charts, near-term support sits around 32.57 with resistance near 33.38 based on the 20-day range. The pivot point is calculated at 32.84, with resistance levels R1 and R2 both around 32.86 and support levels S1 at 32.84 and S2 at 32.82, keeping the immediate trading band unusually tight. Within the broader 52-week range of 30.82 to 33.86, the pair still has room to move in either direction, but the narrowing of these near-term levels suggests traders may be waiting for a fresh catalyst, whether from oil prices, US data, or developments around the US-Iran situation, before committing to a clear direction.
What comes next
Taken together, OCBC's note suggests the path of least resistance for USD/THB may tilt higher in the near term if oil prices keep climbing and the dollar holds on to its post-payrolls gains, even though the pair remains inside a well-defined range for now. Any further escalation in US-Iran tensions, or another round of strong US economic data, could add to the pressure on the baht by keeping both oil and the dollar supported. Conversely, if Friday's payrolls-driven dollar strength proves short-lived, the baht could stabilise, but the fading bullish momentum and softer RSI flagged by OCBC suggest the currency's next move may be more two-sided than the smooth run of gains it enjoyed in recent weeks.