




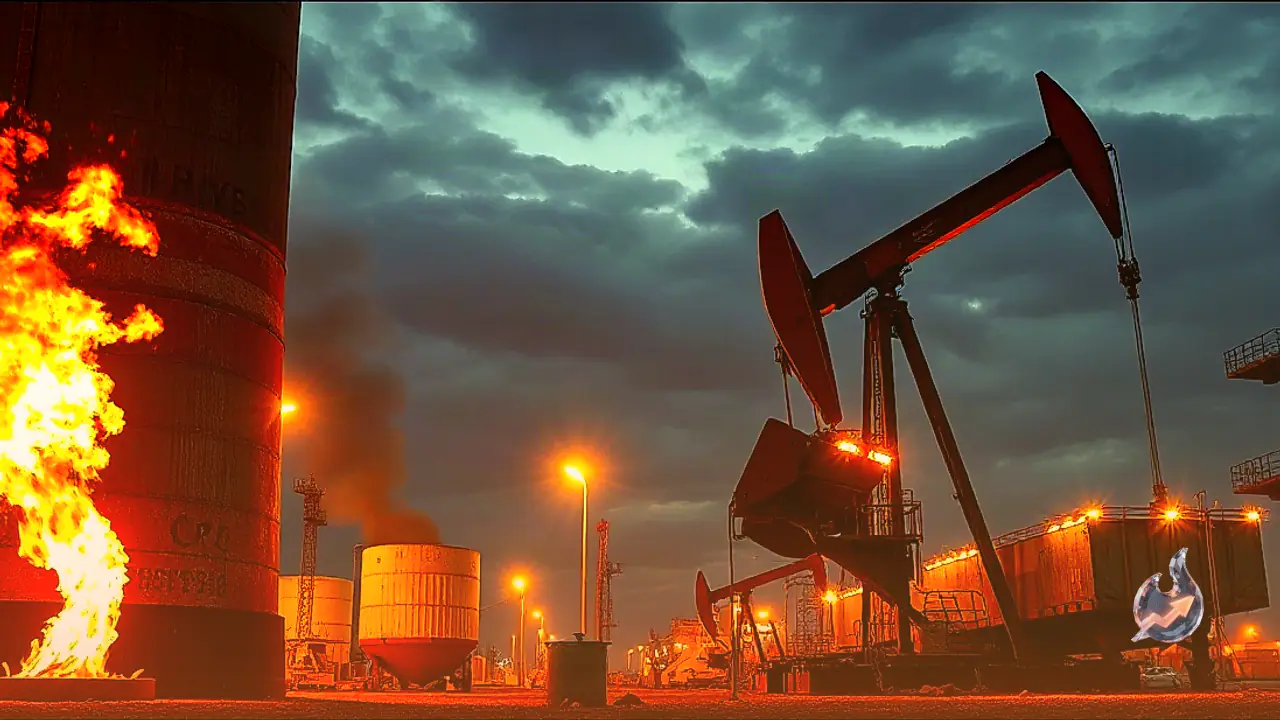


















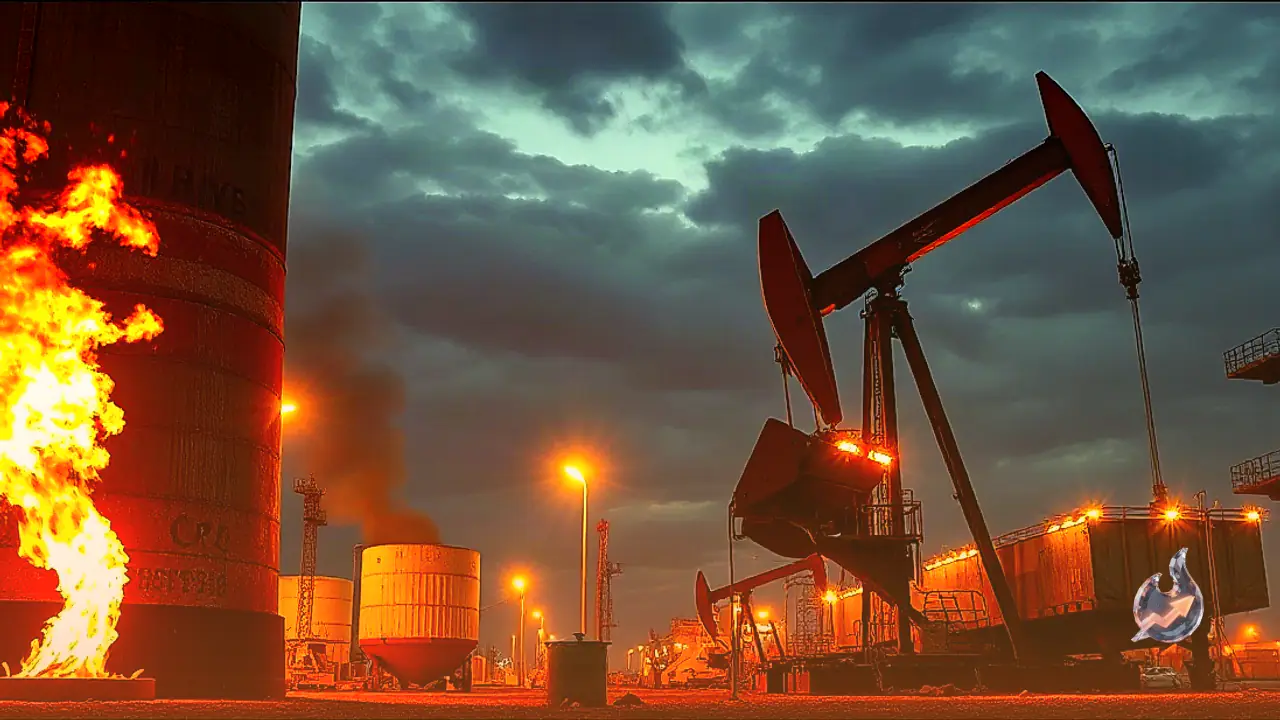

A larger-than-expected increase in US crude stocks gave sellers an opening on Wednesday, pulling the US benchmark back toward $100.00 during the early European session. The American Petroleum Institute said that stocks rose by 7.14 million barrels in the seven-day period through September 11, reversing a 300,000-barrel decline in the prior week and defying expectations for a 1.8 million-barrel draw. The decline did not turn into a clean break because Saudi Arabia stopped loadings at Yanbu after closing the East-West pipeline in the wake of Friday's attack by Houthis in Yemen who are aligned with Iran. The close-bell live data dated 2026-09-16 later showed Crude Oil (CL=F) at $104.83, down 0.94% from the previous close of $105.83.
Inventory surprise flips the near-term signal
The API reading changed the immediate supply-demand picture because traders had been positioned for less crude, not more. A 7.14 million-barrel addition means the market received a clear signal of extra available stock, while the forecast had pointed to a 1.8 million-barrel reduction. That gap between expectation and outcome gave bearish traders a concrete reason to sell WTI.
The contrast with the previous week sharpened the move. Stocks had fallen by 300,000 barrels in the earlier period, so the latest figure was not merely a smaller draw but a complete reversal in direction. In inventory trading, a build can point to softer demand or more supply, both of which can pressure the price of oil.
Middle East disruption limits the selloff
Physical supply concerns prevented the inventory news from dominating the whole story. Loadings at Saudi Arabia's Yanbu port were paused after the country, described as the world's largest crude exporter, shut the East-West pipeline. The shutdown followed an attack on Friday by Houthis in Yemen who are aligned with Iran.
That sequence left traders watching two opposing signals at once. The US stockpile increase argued for more near-term availability, while the pipeline closure and port suspension raised the possibility of disrupted exports from a crucial producing region. The result was a lower WTI reading without the disappearance of Middle East risk from the market.
Rabobank sees a tighter structural backdrop
Rabobank analysts cautioned that this disruption is appearing against an increasingly delicate global stock picture. They said crude inventories worldwide are still falling and strategic petroleum reserves are reaching levels that deserve concern. In their assessment, shrinking commercial stocks and pressured emergency reserves make the market tighter at a structural level, supporting a higher WTI price path in the coming years.
The bank's view helps explain why the inventory build did not erase the wider supply debate. A weekly US stock increase can weaken the short-term price, but falling global stocks and limited strategic buffers can keep the longer-term outlook firm when a major route is interrupted.
Live technical picture remains bullish, but stretched
The updated close-bell live data gives a more current technical picture than the early-session quote. On 2026-09-16, Crude Oil (CL=F) traded at $104.83 against a previous close of $105.83, a 0.94% decline. Its 52-week range was $54.98 to $119.48, and volume was only 0.08x the 20-day average.
- Momentum: RSI(14) stood at 74, which is overbought. MACD was 5.49 versus a 3.90 signal, with a 1.60 histogram, a bullish combination.
- Trend: EMA20 was $93.65, EMA50 $88.20 and EMA200 $78.76. SMA50 was $85.32 and SMA200 $80.27, while EMA50 above EMA200 confirmed a golden cross and a long-term uptrend.
- Bands and volatility: Bollinger(20,2) spanned $76.44 to $106.62 with a $91.53 midpoint, and price remained inside the bands. ADX(14) was 32, showing a trend, while Stochastic fast line 93 and signal line 92 pointed to stretched momentum; ATR(14) was 4.10, the daily volatility measure used as a stop-loss buffer.
- Levels: The 20-day support was around $79.62 and resistance around $106.75. The pivot was $104.90, with R1 at $105.56, R2 at $106.30, S1 at $104.16 and S2 at $103.50.
How WTI is defined and priced
West Texas Intermediate is a grade of crude oil traded internationally, and WTI is its abbreviation. It sits alongside Brent and Dubai Crude among the three widely watched crude categories. Traders call it light and sweet because, respectively, its gravity and sulfur content are relatively low in the description used for this grade. It is regarded as high-quality oil that refiners can process easily.
The crude is produced in the United States and routed through the Cushing hub, which carries the nickname Pipeline Crossroads of the World. WTI serves as a benchmark for the oil market, so its price is quoted frequently in financial and general media.
The balance between supply and demand is the main force behind WTI. Strong global growth can lift demand, while weaker growth can reduce it. Conflict, political instability and sanctions may interrupt flows and move the quote. Production choices made by OPEC also influence the market. Because oil is mainly invoiced in US dollars, a softer dollar can make barrels cheaper for buyers using other currencies, while a stronger dollar can make them more expensive.
Why API and EIA numbers matter
The weekly inventory releases from API and EIA are closely watched because they show how the balance between supply and demand is changing. A decline in stocks may indicate stronger demand and support a higher oil price. A rise can signal greater supply and push prices lower, which is why the latest API build mattered.
API publishes its reading every Tuesday and EIA follows one day later. Their figures usually stay within 1% of each other in 75% of releases. EIA's data is treated as more reliable because it comes from a government agency, so traders use it as an important check on the API number.
OPEC production policy remains a separate lever
OPEC, the Organization of the Petroleum Exporting Countries, brings together 12 oil-producing nations. Members set production quotas for one another at meetings held twice a year, and those decisions can move WTI. Cutting quotas can restrict supply and lift prices, while raising output can increase availability and push prices in the opposite direction. OPEC+ is the wider grouping that adds 10 non-OPEC members, with Russia the most prominent among them.
Dollar, gold, equities and Japan feel the same pressures
The same mix of oil, inflation and central-bank uncertainty was visible across other markets. AUD/USD kept a negative bias for a third straight day in Wednesday's Asian session, defending 0.7100 while trading near a monthly low. The US dollar stayed close to a two-week high as expectations for a Fed rate increase and fears of oil-driven inflation pushed US bond yields toward multi-year highs. Escalating Middle East tensions also supported the dollar as a safe haven and hurt the risk-sensitive Australian currency.
USD/JPY reached a new one-week high above 155.00 in the Asian session as the dollar strengthened. Oil-related inflation worries and the expected Fed rate increase continued to lift US bond yields, while rising US-Iran tensions reinforced the dollar's reserve-currency role. The pair stayed below the mid-155.00s because buyers were cautious before the Fed decision later that day and the Bank of Japan meeting beginning Thursday.
Gold could not turn its small intraday rise into a larger advance and remained below $4,350 through the Asian session. The dollar paused after reaching a two-week high, which gave the metal some support. Even so, traders avoided aggressive directional positions and waited on the sidelines for the major central-bank event.
Asian equity markets opened Wednesday with modest gains, helped by stable US stock-index futures, but caution dominated ahead of the closely watched Fed policy decision. Expensive oil, worsening Middle East tensions and rising bond yields kept sentiment fragile.
Japan's ultra-low interest rates had financed trillions of dollars in global investment for more than a decade, making the yen one of the cheapest funding currencies in the world. With the Bank of Japan expected to tighten policy again during the week, that advantage could be entering a different phase. Most major economies had already raised rates, leaving Japan as the notable outlier.
What traders will watch next
Traders now have several concrete events to monitor. EIA's inventory release follows API's report by one day, while the market also watches whether Saudi loadings resume and whether the East-West pipeline remains closed. The Fed decision later Wednesday and the Bank of Japan meeting beginning Thursday add another layer because oil-driven inflation fears, bond yields and currency moves are all feeding into the same risk picture.