
























Trading in the global foreign exchange market commenced on a resilient footing for the US Dollar as participants digested signals pointing to sustained monetary policy restriction by the Federal Reserve. Boosted by mounting expectations that the American central bank is poised to deliver further monetary tightening before the end of the year, the US Dollar Index (DXY), which measures the currency's value against a basket of six major counterparts, advanced 0.15% to trade around 100.37. The Greenback displayed its strongest performance against the Japanese Yen, reinforcing broad dollar demand across trading desks. Investors are closely monitoring a series of scheduled speeches from Federal Reserve policymakers alongside high-stakes diplomatic deliberations in New York between United States leadership and Gulf nation representatives.
Federal Reserve Policy Outlook and Interest Rate Expectations
Market pricing reflected in interest rate futures indicates a decisive conviction that the Federal Reserve has not concluded its tightening campaign. According to data tracked by the CME FedWatch tool, the probability of the central bank executing at least one more interest rate increase within this calendar year stands at roughly 88%. This elevated likelihood of sustained borrowing costs has reinforced the yield advantage of the dollar, discouraging aggressive short positioning even amidst pockets of macroeconomic uncertainty across global markets.
Speaking over the weekend during an interview on Fox News' Sunday Morning Futures, Minneapolis Fed Bank President Neel Kashkari articulated the ongoing concerns confronting monetary authorities. Kashkari highlighted that elevated inflation remains a primary challenge for policymakers, stressing that price pressures extend considerably beyond recent fluctuations in crude oil prices. His commentary evaluated at a 6.2 reading on the FXS Speechtracker, closely aligning with the historical benchmark of 6.3 and reflecting a steadfast hawkish stance that rules out premature policy easing.
The central premise delivered by Kashkari centered on the necessity of maintaining restrictive policy in the face of resilient economic performance, robust business activity, and continuing productivity gains. He remarked that bond market movements remain the purview of the Treasury, emphasizing that the central bank must keep its strategic focus trained on underlying price pressures and a durable labor backdrop rather than temporary market swings. Parallel to his comments, the FXS Fed Sentiment Index retreated by 1.47 points to settle at 150.61. While reflecting a slight moderation in hawkish intensity, the index remains comfortably above the neutral 100 threshold, confirming that the prevailing Federal Reserve narrative continues to favor higher-for-longer borrowing rates.
Technical Structure and Live Dollar Index Chart Dynamics
On the daily spot chart, the Dollar Index is changing hands at 100.35, maintaining an upward bias following a decisive technical move above its 20-day exponential moving average (EMA) situated at 99.63. This upward push confirms that near-term momentum has rotated in favor of buyers. Live market data records the Dollar Index at 100.33, up 0.11% from the prior closing mark of 100.22. Over the preceding 52 weeks, the index has carved out a trading band between 95.55 and 101.80, with daily volume holding steady at 1.00 times its 20-day moving average.
Technical momentum gauges remain constructive without signaling exhausted buying pressure. The Relative Strength Index (RSI) stands at 63.15, while the live 14-period RSI is computed at 62, firmly located in bullish territory and leaving headroom before reaching overbought parameters. The Moving Average Convergence Divergence (MACD) registers at 0.10 against a signal line of -0.08, generating a positive histogram reading of 0.18. Key moving averages align constructively: the 20-day EMA resides at 99.66, the 50-day EMA at 99.75, and the 200-day EMA at 99.30, alongside the 50-day SMA at 99.94 and the 200-day SMA at 99.16. The presence of a golden cross between the 50-day and 200-day moving averages underpins the broader structural uptrend.
Chart levels indicate that the central daily pivot is positioned at 100.30. Immediate resistance overhead emerges at R1 100.41 and R2 100.48, with the previous week's peak of 100.55 and the 20-day technical ceiling at 100.56 acting as major milestones for extended upside. Conversely, immediate support lines are marked at S1 100.23 and S2 100.13, while the broader 20-day support floor sits near 98.60. Bollinger Bands (20, 2) delineate a channel between 98.45 and 100.43 around a midpoint of 99.44, with price currently contained within the upper boundary. Trend strength reflected by an ADX reading of 27 confirms directional momentum, supported by stochastic fast and signal lines at 88. The 14-period Average True Range (ATR) of 0.43 outlines expected daily volatility, providing a practical parameter for stop-loss calibration. Sustaining trade above the 20-day EMA at 99.63 remains essential to prevent momentum deterioration.
Cross-Asset Movements and International Developments
Geopolitical intersections are also shaping market sentiment at the start of the week. Global attention is directed toward New York, where United States President Donald Trump is scheduled to meet with leaders representing Gulf nations during the United Nations General Assembly beginning Monday, September 21. Developments emerging from these diplomatic talks carry potential ramifications for Middle Eastern security and regional energy logistics, factors capable of transmitting shocks through global inflation channels.
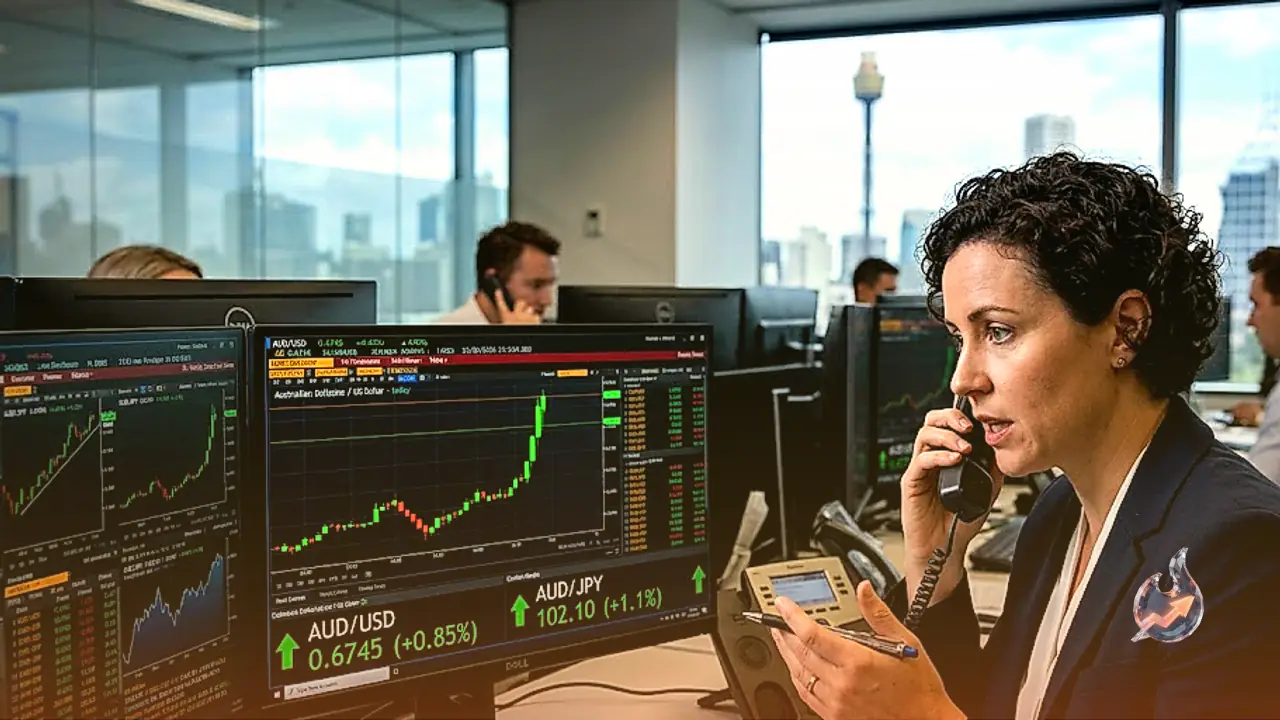
In currency pairs, the Australian Dollar held firm above 0.7100 against the US Dollar during Monday's Asian trading session. While the People's Bank of China maintained its benchmark Loan Prime Rates without adjustment, dampening some regional enthusiasm, expectations that the Reserve Bank of Australia might execute an additional rate hike lent support to the currency ahead of the anticipated Trump-Xi summit. Meanwhile, USD/JPY receded below 157.00 in Asia as the Yen gained temporary ground following Friday's Bank of Japan rate check, which raised caution regarding potential foreign exchange intervention. Japanese market holidays and ongoing conflicts in Eastern Europe and the Middle East kept trading cautious. In policy actions, the Bank of Japan advanced its monetary normalization by lifting its short-term interest rate target from 1.00% to 1.25% in a 7-2 split decision, matching broad market forecasts.
In alternative assets, gold struggled to sustain upside traction after stalling near the $4,400 per ounce threshold on Friday, retreating toward $4,350 as traders evaluated the monetary policy repercussions of the Middle East situation. In digital assets, Dogecoin continued its upward trajectory, holding above $0.088 following a weekly advance of nearly 6%, aided by returning institutional interest through spot DOGE Exchange Traded Funds, improving momentum signals, and observable whale accumulation. In the United States, economic releases remain relatively sparse this week, with investor focus centering on Thursday's new home sales data, where consensus anticipates an August rebound of 2.6% to an annualized pace of 623,000 units following sharp contraction in July.