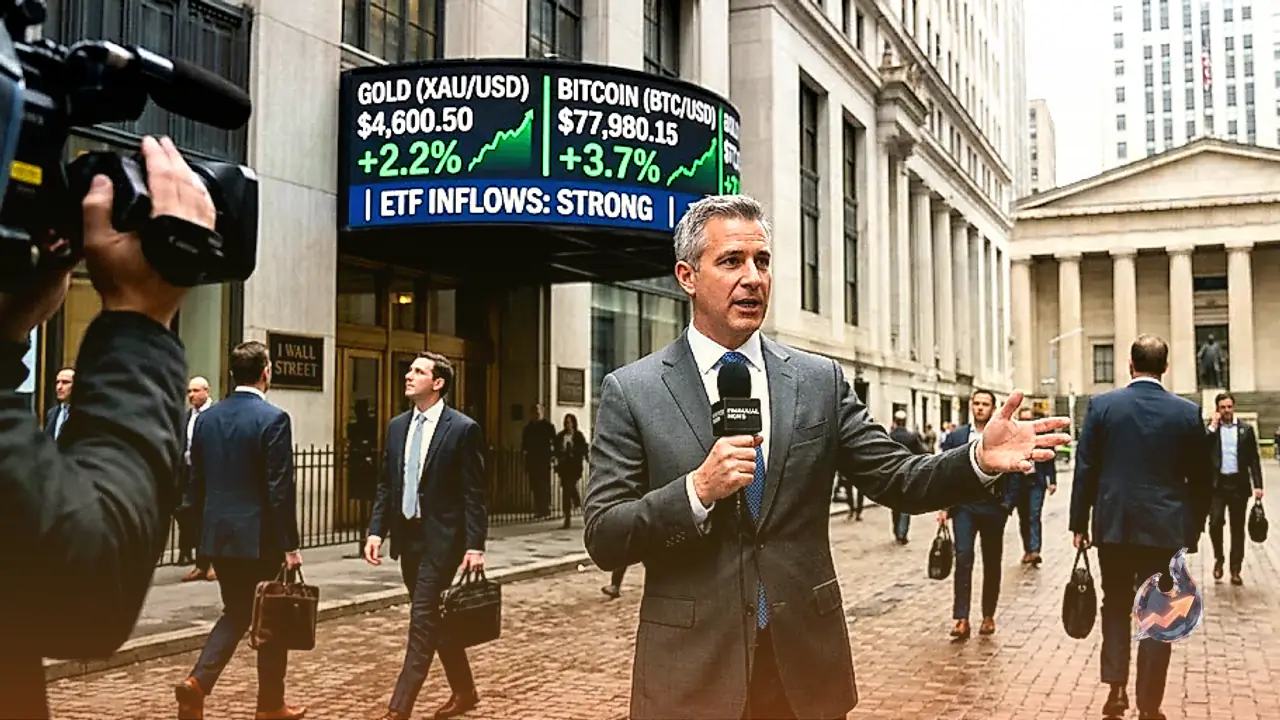

























Major cryptocurrencies are exhibiting signs of a momentum pause following a phenomenal week of gains across the digital asset space. Bitcoin trades around $77,000 on Monday, maintaining a bullish bias but appearing technically stretched after surging 23.58% over the course of the previous week. This cooling-off phase reflects a broader market hesitation as key technical boundaries are tested by traders.
Ethereum and Ripple Show Overbought Pressures
Ethereum momentum indicators signal strong overbought conditions following a 31.31% surge last week, pointing directly toward an impending corrective pause. Meanwhile, XRP trades around $1.48 on Monday after skyrocketing 53.02% during the prior week. Both altcoins are experiencing heightened volatility and profit-taking pressures after registering massive double-digit weekly advances.
Detailed Technical Indicators and Moving Averages
Market momentum is currently overheated, with the Relative Strength Index holding firmly in overbought territory at 78 and the Moving Average Convergence Divergence remaining deeply positive. This combination hints that while buyers remain in control of the broader trend, the underlying risk of a corrective pause is steadily rising. On the downside, any potential pullback is likely to first test the 200-day exponential moving average near $71,834, with additional exponential moving average cushions supporting prices at $67,408 and $66,774 respectively. On the topside, a sustained push toward the $80,000 threshold would keep the overarching uptrend entirely intact despite the overheated momentum backdrop.
Ethereum trades at $2,415, maintaining a solid bullish near-term bias as prices remain comfortably positioned above the 50-day, 100-day, and 200-day exponential moving averages. The clustering of these short- and medium-term moving averages below the market indicates a well-supported uptrend, while the Relative Strength Index near 76 highlights persistent overbought conditions. The Moving Average Convergence Divergence remains firmly positive, reinforcing underlying upside strength, though these elevated readings suggest a corrective pause remains entirely possible. Immediate resistance on the topside is identified at the horizontal barrier around $2,500, followed by a more significant price cap near $3,000. Conversely, initial downside support is found right in the current trading zone, backed by deeper protection from the 200-day exponential moving average near $2,142 and the psychological $2,000 level.
XRP trades at $1.467 on Monday, extending its strong upswing after surging over 50% through the preceding week. The asset trades comfortably above its 50-day, 100-day, and 200-day exponential moving averages at $1.141, $1.181, and $1.350, respectively, which underpin a clear bullish near-term trajectory. This upward surge has been heavily fueled by robust market participation, with daily trading volumes comfortably outpacing prior weeks. At the same time, the Relative Strength Index at 78 sits squarely in overbought territory, suggesting the ongoing rally is stretched even as the Moving Average Convergence Divergence reinforces upward momentum. Initial downside demand is anticipated around $1.350, supported by horizontal levels at $1.300, while a break higher targets the formidable resistance barrier at $1.900.
External Catalysts and Macroeconomic Influences
Beyond technical metrics, various external developments continue to shape digital asset demand and network adoption. New token launches and exchange listings regularly deepen asset liquidity and expand network participation, creating inherently bullish conditions. Conversely, security breaches and exploits involving decentralized finance bridges or exchange hot wallets can trigger sudden en masse panic and subsequent sell-offs across affected markets. Macroeconomic factors, particularly United States Federal Reserve interest rate decisions and United States Treasury debt buyback operations, also exert profound direct influences on cryptocurrency valuations by dictating broader dollar strength and trading leverage costs.