
























The headline figure of $638 million spent on buybacks across decentralized finance (DeFi) protocols appears, at first glance, to signify robust financial health and strong bullish sentiment in the cryptocurrency ecosystem. However, a deeper examination reveals a significantly more concentrated and nuanced reality. Nearly 90% of this total buyback volume is driven by just two decentralized platforms, while structural market factors like token unlocks, high fully diluted valuations, and impending regulatory shifts in the United States present substantial hurdles to sustained price growth.
Concentration at the Top: The Math Behind the $638 Million Boom
While the overall figure of $638 million suggests widespread adoption of token repurchases across the DeFi ecosystem, the reality is far more isolated. Hyperliquid and Pump.fun account for almost 90% of all DeFi buyback volume. Hyperliquid alone contributed approximately $370 million, while Pump.fun added nearly $200 million. This high level of concentration means that the broader DeFi sector is largely not participating in this buyback trend to the degree that headline numbers imply.
Understanding this concentration is vital for crypto investors. Token buybacks are designed to reduce circulating supply by purchasing tokens from the open market, often using platform revenues. However, buybacks do not automatically eliminate broader structural risks such as continuous token unlocks, general supply dilution, or regulatory pressures. In many cases, protocol buybacks simply create artificial demand or provide exit liquidity against which early venture capital investors, team members, or early holders can offload their positions.
Valuation Disconnect: FDV vs Market Capitalization and Upcoming Unlocks
The operational mechanics of Hyperliquid highlight the tensions between token buybacks and supply expansion. Hyperliquid currently commands a market capitalization of around $18.51 billion based on its active circulating supply. However, its Fully Diluted Value (FDV), which accounts for the total theoretical supply of all tokens including locked and unissued ones, stands at an immense $77.97 billion. Over half of Hyperliquid’s total supply, specifically 53.51%, remains locked in smart contracts.
This massive gap between circulating supply and total supply creates long-term dilution risk. While retail-generated protocol fees fund aggressive buybacks on the exchange, these repurchases may end up serving as exit liquidity for incoming token releases. For instance, an unlock event scheduled for Saturday will release 433,000 HYPE tokens, representing 0.19% of the released supply, alongside ongoing unlocks from futures contracts. While Hyperliquid experienced an impressive 70% rally over the past year backed by its narrative as an all-in-one trading exchange, token buybacks alone cannot guarantee long-term price floors across different market cycles.
The Burn Problem: Supply Overhangs in Chainlink, Jupiter, and THORChain
A crucial distinction in tokenomics lies in whether repurchased tokens are permanently destroyed or merely stored in a treasury reserve. Permanent token burns reduce the overall supply irrevocably, creating true deflationary dynamics. Conversely, holding repurchased tokens in treasury leaves open the possibility of future market re-entry.
Chainlink presents a clear case of treasury accumulation without burning. The protocol currently holds a reserve of 5.77 million LINK tokens accumulated through ongoing buybacks. Because these tokens have not been burned, they create a persistent secondary supply overhang that can weigh on long-term investor sentiment. Meanwhile, decentralized exchange Jupiter (JUP) and cross-chain liquidity network THORChain (RUNE) both executed substantial token buybacks funded by protocol revenue, yet both native tokens subsequently suffered steep double-digit price drawdowns. These historical precedents demonstrate that buybacks alone cannot arrest price declines when broader market momentum or fundamental demand turns negative.
Regulatory Crossroads: The Howey Test, SEC, and CFTC Oversight
The aggressive shift toward revenue-funded buybacks in DeFi coincides directly with significant legislative changes unfolding in Washington. The United States Senate is expected to vote on the Digital Asset Market Clarity Act in mid-September, a decision that could redefine regulatory boundaries for decentralized protocols.
When DeFi protocols allocate more than half of their revenue directly into buying back their own native tokens, their operational structure closely mirrors traditional corporate equities that distribute stock dividends. This economic structure significantly increases the likelihood that these tokens could trigger the criteria of the Howey Test. Under the Howey Test, an asset is classified as an investment contract and thus a security if individuals invest money in a common enterprise with a reasonable expectation of profits derived primarily from the entrepreneurial or managerial efforts of others.
If financial regulators determine that revenue-sharing buyback tokens qualify as securities, these protocols would lose the more flexible oversight of the Commodity Futures Trading Commission (CFTC). Instead, they would fall under the strict enforcement jurisdiction of the Securities and Exchange Commission (SEC), exposing project teams and token holders to stringent compliance demands and potential legal enforcement actions.
Macro Backdrop and Technical Landscape: Bitcoin, XRP, XLM, and Altcoin Performance
The broader cryptocurrency market reflects mixed sentiment amid these structural DeFi developments. Live market data shows Bitcoin (BTC) trading at $80,849, down slightly from its previous close of $81,272 (-0.52%). BTC has traded within a 52-week range of $57,748 to $97,861, with current trading volume sitting at 1.17 times its 20-day average. Technical indicators show a 14-day Relative Strength Index (RSI) at 71, indicating overbought conditions, while the MACD histogram stands at 25.01 with a signal line of 3485.56, maintaining a short-term bullish posture. Key moving averages indicate an Exponential Moving Average (EMA20) at $75,794, EMA50 at $71,093, and EMA200 at $73,622. Key technical levels highlight pivot point support at $80,976, with immediate resistance at $81,265 (R1) and $81,682 (R2), and downside support at $80,559 (S1) and $80,270 (S2).
Earlier trading saw Bitcoin hovering above $77,000 as its 90-day correlation with Gold reached nearly 50%, reflecting growing macroeconomic sensitivity. Technical analysis from Glassnode suggests that Bitcoin's recovery faces resistance as it trades between a key accumulation zone below current prices and significant potential overhead supply. In the short term, Bitcoin remains within a rising trend channel with support around 77,500 points. Over the medium term, BTC broke above the ceiling of a falling trend channel, meeting its initial inverse head and shoulders pattern target of 74,244 and now approaching major resistance near 84,000 points.
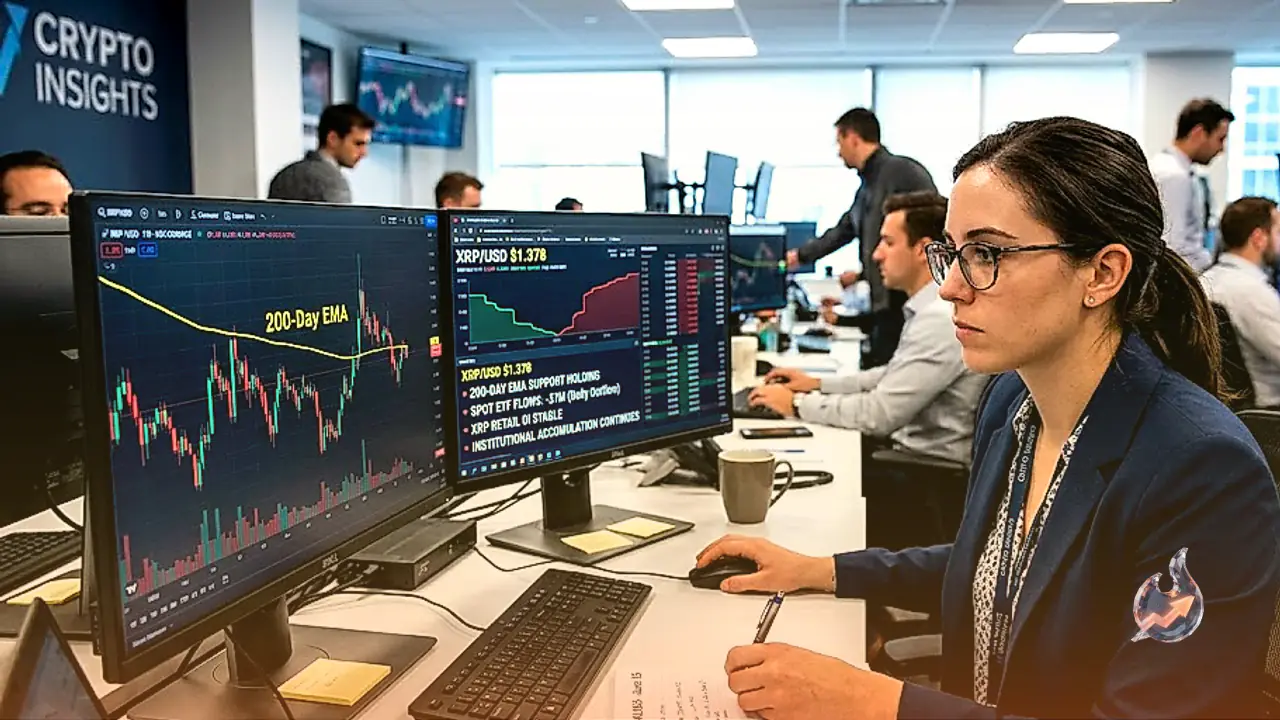
Elsewhere in the market, Ripple (XRP) and Stellar (XLM) show divergent technical setups; XRP is establishing a key support zone while XLM has fallen below a cluster of Exponential Moving Averages. Meanwhile, layer-2 protocol Arbitrum and oracle project Pyth Network emerged as top daily performers, posting solid double-digit gains over the last 24 hours.