























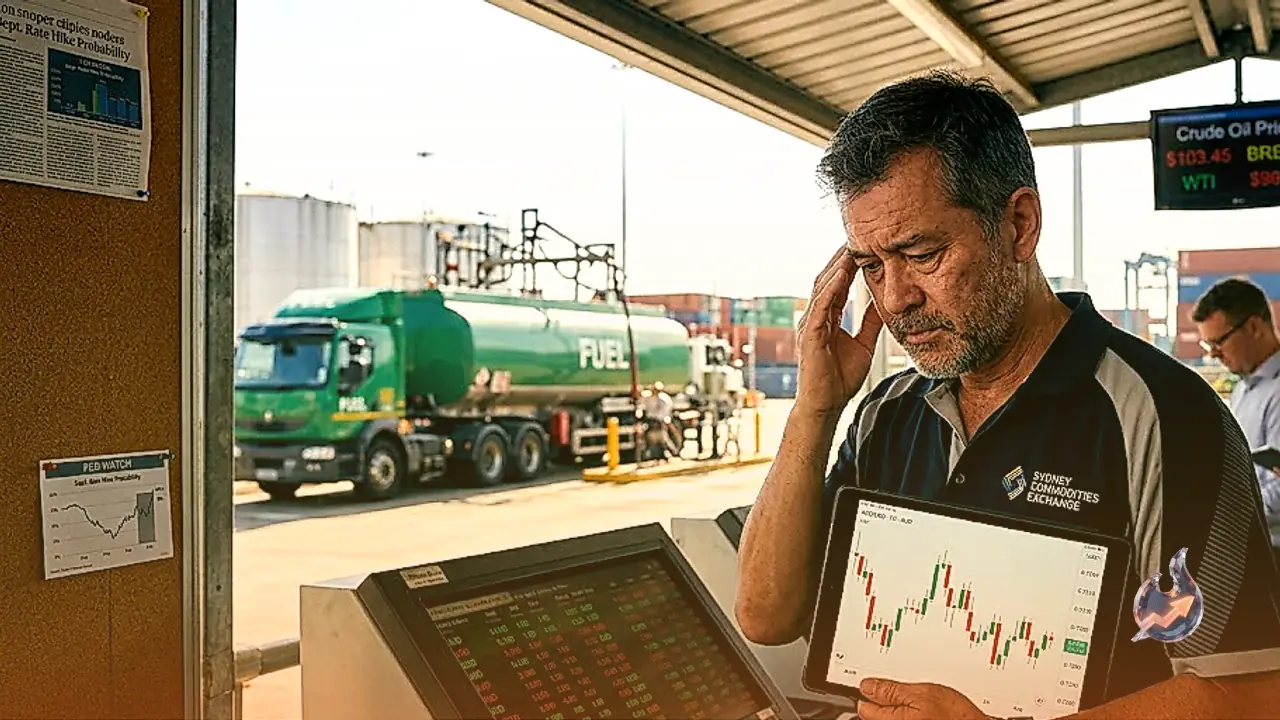

The Australian Dollar hit a strong barrier near the 0.7220 handle during Tuesday's Asian trading session, pausing its recent upward movement despite hovering close to its highest valuation since May 14. A complex mix of global macroeconomic drivers is at play, as a sharp resurgence in energy prices and persistent hawkish expectations surrounding the US Federal Reserve have provided fresh momentum to the Greenback. Although selling pressure on the US Dollar was initially sustained by a rally in the Japanese Yen and market anticipation of another interest rate hike by the Reserve Bank of Australia later this month, gains in the AUD/USD pair remained capped due to mixed economic trade balance figures coming out of China.
Australian Dollar Struggles Near Multi-Month Highs Amid Mixed Global Signals
Trading conditions for the Australian Dollar presented a multi-faceted picture across foreign exchange markets. The Aussie demonstrated notable relative strength against several major peers, emerging as the strongest performer against the New Zealand Dollar. This relative outperformance was buttressed by underlying expectations that the Reserve Bank of Australia may implement another interest rate hike during its upcoming monetary policy meeting. Higher domestic yield projections have offered a persistent tailwind for the Australian currency in recent weeks.
However, broader upside momentum was constrained by mixed macroeconomic data from China, Australia's primary trading partner. Uneven trade balance performance highlighted lingering uncertainty regarding Chinese demand recovery, preventing currency buyers from pushing the AUD/USD pair decisively beyond resistance levels. Meanwhile, global currency dynamics were further complicated by sharp moves in the Japanese Yen. The USD/JPY currency pair fluctuated around the 154.00 level during the American session on Tuesday, staging a technical correction after bouncing off a six-month low below 153.00 recorded earlier in the day.
The resilience of the Japanese Yen continues to stem from robust domestic economic metrics. Upbeat wage growth statistics in Japan, combined with an upward revision to second-quarter Gross Domestic Product (GDP) figures, have solidified market expectations that the Bank of Japan will proceed with an interest rate hike at its policy meeting next week. These hawkish expectations from Japan have counterbalanced broader US Dollar strength, adding an extra layer of volatility to international currency pairs.
Technical Analysis: Key Support Zones and Momentum Indicators for AUD/USD
From a technical charting perspective, the AUD/USD currency pair continues to display a constructive near-term structure on the daily timeline. Trading at 0.7220, the currency pair remains positioned comfortably above a dense cluster of major moving averages. Specifically, the 50-day, 100-day, and 200-day Simple Moving Averages (SMAs) are tightly grouped near the 0.7051 level, creating a formidable long-term support foundation. Furthermore, price action is being carried higher by a series of ascending trend lines established from the mid-0.68s to 0.69s region.
Technical momentum indicators suggest that while the uptrend remains firmly intact, the pair may require a period of consolidation before attempting further advances. The Relative Strength Index (RSI) currently sits at approximately 68, placing it just below the traditional overbought threshold of 70. This elevated RSI reading signals robust buying momentum, but also warns traders that the pair could be vulnerable to a temporary pause or a shallow price retracement.
On the downside, initial horizontal support is identified near the 0.7198 level. A sustained drop below this immediate threshold would direct market focus toward the broader demand zone anchored around the 0.7051 triple SMA cluster and the supporting trend lines. While explicit upside resistance targets remain open-ended on current chart configurations, technical market structure suggests that dips toward 0.7198 and the 0.7050 region are likely to attract active dip-buying interest from market participants.
Federal Reserve Expectations and Upcoming US Inflation Benchmarks
The broader backdrop for global currency markets remains heavily dictated by Federal Reserve monetary policy expectations and escalating geopolitical tensions. Market pricing data from Prime Terminal indicates a 63% probability that the US Federal Reserve will announce a quarter-percentage-point (25 basis points) interest rate increase at its upcoming FOMC policy meeting scheduled for September 15-16. Geopolitical developments have further reinforced market bets on Fed tightening, supporting baseline demand for the Greenback.
Market participants are now focusing intensely on upcoming US inflation metrics to confirm the Fed's policy trajectory. The impending release of the July Consumer Price Index (CPI) and Producer Price Index (PPI) is viewed as the definitive catalyst for September's policy decision. Consensus forecasts project headline July CPI at 0.4% Month-over-Month (MoM) and 3.4% Year-over-Year (YoY). Core CPI figures, which exclude volatile food and energy components, are anticipated to print at 0.2% MoM and 2.4% YoY. Should these inflation readings surpass market expectations, analysts anticipate a surge in hawkish Fed pricing, prompting traders to bid up the US Dollar aggressively.
Recent survey data presents a nuanced picture of US economic conditions. The New York Fed Survey of Consumer Expectations revealed that American households anticipate a slight decline in three-year and five-year inflation expectations in August. Conversely, business sentiment remains cautious. The NFIB Small Business Optimism Index edged lower to 98.7 in August, though it managed to stay above its long-term historical average of 98.0. Significantly, one-third of surveyed small businesses reported plans to raise prices in August, while 28% project price increases over the coming months, highlighting underlying price pressures within the economy.
Energy Shock: Record Diesel Crack Spreads and Crude Oil Dynamics
While headline energy benchmarks appeared relatively stable earlier in the summer, secondary refined product markets are sending powerful inflationary signals. The US diesel crack spread, which measures the differential premium of ultra-low sulphur diesel futures over West Texas Intermediate (WTI) crude oil, recently surged above $100 per barrel for the first time in history. The spread reached an intraday record high of just over $102.00 per barrel, reflecting severe tightness in refined fuel supplies and burgeoning transport costs.
This surge in refined fuel margins has coincided with a broad rally across underlying energy commodities. In live market trading, WTI Crude Oil futures (CL=F) surged to $94.37 per barrel, marking a daily gain of +3.16% over the previous close of $91.48. Over the past 52 weeks, crude oil prices have traversed a wide band between $54.98 and $119.48 per barrel. Trading volume was recorded at 0.01 times the 20-day average. Technical indicators for Crude Oil highlight strong bullish momentum: the 14-day RSI stands at 69, while the MACD indicator reflects a bullish configuration with the MACD line at 2.65 against its signal line of 1.74, generating a positive histogram reading of 0.91.
Crude oil moving averages reinforce a sustained long-term uptrend. The 20-day Exponential Moving Average (EMA) sits at $86.72, the 50-day EMA at $84.52, and the 200-day EMA at $77.06. Corresponding Simple Moving Averages show the 50-day SMA at $81.46 and the 200-day SMA at $78.98, confirming a golden cross setup where shorter-term moving averages remain well above long-term indicators. Price action has pushed past the upper Bollinger Band boundary of $93.41, operating above the 20-day mid-band of $86.05 and lower band of $78.68. The Average Directional Index (ADX) reads 19, indicating range dynamics within an ascending channel, while the Stochastic indicator shows fast and signal lines at 99 and 91 respectively.
Daily price volatility for Crude Oil is reflected in an Average True Range (ATR) of 3.56, offering a clear benchmark for risk management and stop-loss buffer placement. Technical chart structure defines key support around $79.62 and overhead resistance near $94.47. Daily pivot calculations place the central pivot point at $94.33, with immediate resistance levels at R1 of $94.51 and R2 of $94.65, while support thresholds are positioned at S1 of $94.19 and S2 of $94.01. As energy costs continue to exert upward pressure on global inflation expectations, foreign exchange markets remain on high alert for further spillovers into interest rate policies and currency valuations worldwide.