























The British Pound (GBP) is trading just beneath 1.3650 against the US Dollar (USD), marking its highest level in more than four months. However, financial market analysis suggests that this foreign exchange momentum is largely being driven by broad-based weakness in the Greenback rather than robust UK economic fundamentals. While UK headline inflation accelerated to 2.9% year-on-year (YoY) in July from 2.6% in June, the entire uptick is attributed to a scheduled 13% increase in the household energy price cap implemented at the start of July, with another hike scheduled for October. Services inflation, which the Monetary Policy Committee (MPC) tracks as its core gauge of domestic price persistence, actually eased to 3.4% from 3.6%.
Inflation Dynamics and Energy Cap Adjustments
The detailed breakdown of the July inflation report confirmed that headline CPI printed at 2.9% YoY, exactly matching market consensus expectations. On a monthly basis, the inflation rate rose by 0.3%, while core CPI held steady at 2.6% YoY against a forecasted 2.5%. Because the acceleration traces almost entirely to regulated energy bill adjustments, interpreting this print as a signal of emerging demand-driven price pressure represents a misreading of the underlying data.
The Bank of England (BoE) had previously communicated to financial markets that it expects headline inflation to peak near 3.2% in the fourth quarter. Consequently, the upward trajectory is scheduled rather than discovered, and an administrative energy bill increase does not alter the wage and service sector dynamics upon which interest rate decisions are built. In the pipeline data, core output producer prices firmed to 2.8% YoY from 2.6%, whereas headline producer price inflation decelerated to 3.1% from 3.5%.
Bank of England Rate Outlook and Goldman Sachs Projections
At its July 30 meeting, the Monetary Policy Committee voted 6-3 to maintain the benchmark bank rate at 3.75%, with three dissenting members voting in favor of a 25 basis point rate cut. The committee is set to convene again on September 17. Current futures market pricing reflects approximately a 30% probability of an interest rate hike before year-end, while a consensus of surveyed economists anticipates no policy rate adjustments for the remainder of the year.
Analyst commentary from Goldman Sachs forecasts no interest rate increases through 2026. The firm highlighted that the divergence between current market pricing and its hold forecast presents ongoing downside risk for Sterling in the coming months. A market re-pricing does not require an external economic shock; a currency carrying a rate hike premium against a central bank that fails to deliver tends to surrender that premium incrementally as inline economic data passes without triggering policy action.
US Treasury Liquidity Support and Dollar Weakness
The Sterling advance has been significantly amplified by selling pressure on the US Dollar across major currency pairs. The decline in Greenback yields followed strategic actions by the US Treasury Department in the sovereign debt market, dating the currency movement to monetary events in Washington rather than London.
On Wednesday at 12:32 GMT, the US Treasury announced a substantial expansion of its liquidity support buyback operations. The department plan calls for at least doubling buybacks in the 10-year to 20-year and 20-year to 30-year maturity sectors, raising the maximum operation size from $2 billion to at least $4 billion. Effective from September 9 through November 4, this initiative injected demand into long-dated Treasuries, pulling yields lower and weakening the US Dollar Index.
Upcoming Economic Calendar: PMIs and Retail Sales
Investors are monitoring a cluster of economic indicators scheduled for release. UK August consumer confidence data is expected to show a reading of -18 compared to -17 previously. July retail sales data scheduled for 06:00 GMT is projected to contract by -0.5% month-on-month (MoM) following a 1.0% expansion in June. On an annualized basis, retail sales growth is forecasted to slow to 2.2% from 4.2%, with ex-fuel sales expected at -0.5% MoM compared to 1.1% prior.
Flash August Purchasing Managers Index (PMI) figures arrive at 08:30 GMT. Consensus forecasts expect the composite PMI to edge lower to 51.5 from 52.2, manufacturing PMI to slip to 51.5 from 51.9, and services PMI to ease to 51.8 from 52.1. The relative strength seen in July manufacturing was partially driven by precautionary inventory buildup due to Middle East trade route disruptions; thus, a moderate pullback in August reflects an inventory cycle recalibration rather than deteriorating baseline demand. Subsequently, US flash PMI data at 13:45 GMT (manufacturing expected at 53.8, services at 54.0) will precede the Jackson Hole economic symposium starting August 27.
Technical Analysis and Key Chart Levels
From a technical standpoint, GBP/USD maintains a short-term bullish posture as long as price action remains above the 1.3600 handle. However, the daily Stochastic RSI indicator is trading above 90, signaling overbought conditions that leave the pair vulnerable to corrective retracements if upcoming economic releases disappoint.
- Resistance Levels: Immediate resistance sits at the recent multi-month session peak just above 1.3650. A clean breakout above this level opens the path toward the 1.3700 psychological threshold.
- Support Levels: Primary technical support is established at the session low near 1.3600. Below that, 1.3550 acts as secondary support, followed by the rising 50-day Exponential Moving Average (EMA) near 1.3450. A daily close beneath 1.3600 would signal a potential bearish reversal.
- Moving Averages & Oscillators: The pair trades above its 20-day EMA (1.35), 50-day EMA (1.34), and 200-day EMA (1.34), confirming a golden cross structure. The 14-day RSI stands at 69, while MACD registers 0.01 above the signal line.
Broader FX, Commodity, and Crypto Markets
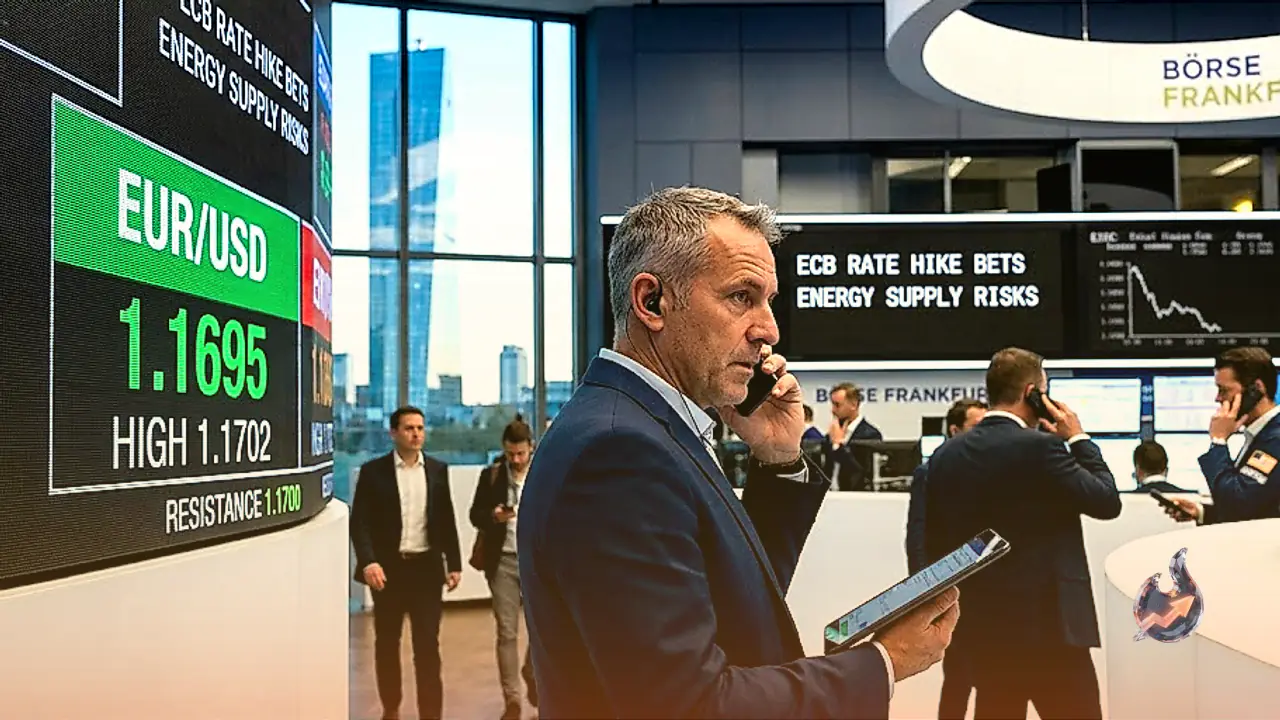
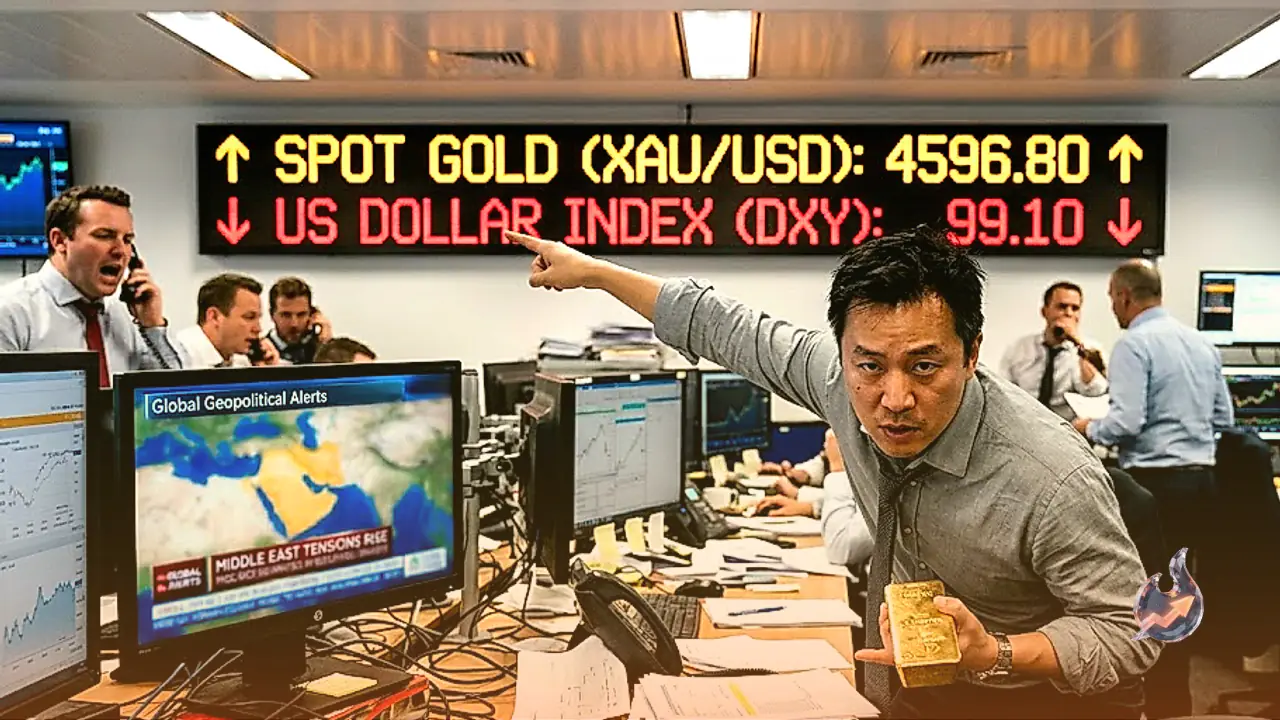
In adjacent currency markets, EUR/USD surrendered its intraday gains to trade back below the 1.1700 level following the late recovery in the Greenback. Meanwhile, spot Gold reclaimed technical territory above $4,500 per troy ounce despite firming Treasury yields.
In the digital asset space, Ripple (XRP) maintained bullish momentum above $1.16, extending its weekly gains past 20%. The broader Crypto Fear & Greed Index advanced from 46 to 62, moving firmly into Greed territory and indicating expanding market risk appetite.
Historical Background and Structural FX Mechanics
Established in 886 AD, the British Pound Sterling (GBP) is the world's oldest currency continuously in use. Issued by the Bank of England, it ranks as the fourth most traded currency globally, accounting for approximately 12% of total foreign exchange turnover with an average daily trading volume of $630 billion according to 2022 central bank data. Major trading pairs include GBP/USD ('Cable', 11% of FX turnover), GBP/JPY ('Dragon', 3%), and EUR/GBP (2%).
The primary determinant of Sterling's valuation is Bank of England monetary policy. The BoE targets price stability with an inflation benchmark of 2%. Raising interest rates to curb inflation makes Sterling-denominated assets more attractive to global capital, supporting currency valuation. Conversely, rate cuts aimed at stimulating sluggish economic growth tend to weigh on exchange rates. External trade balance figures also directly impact currency valuation by modifying net structural demand for UK exports.