























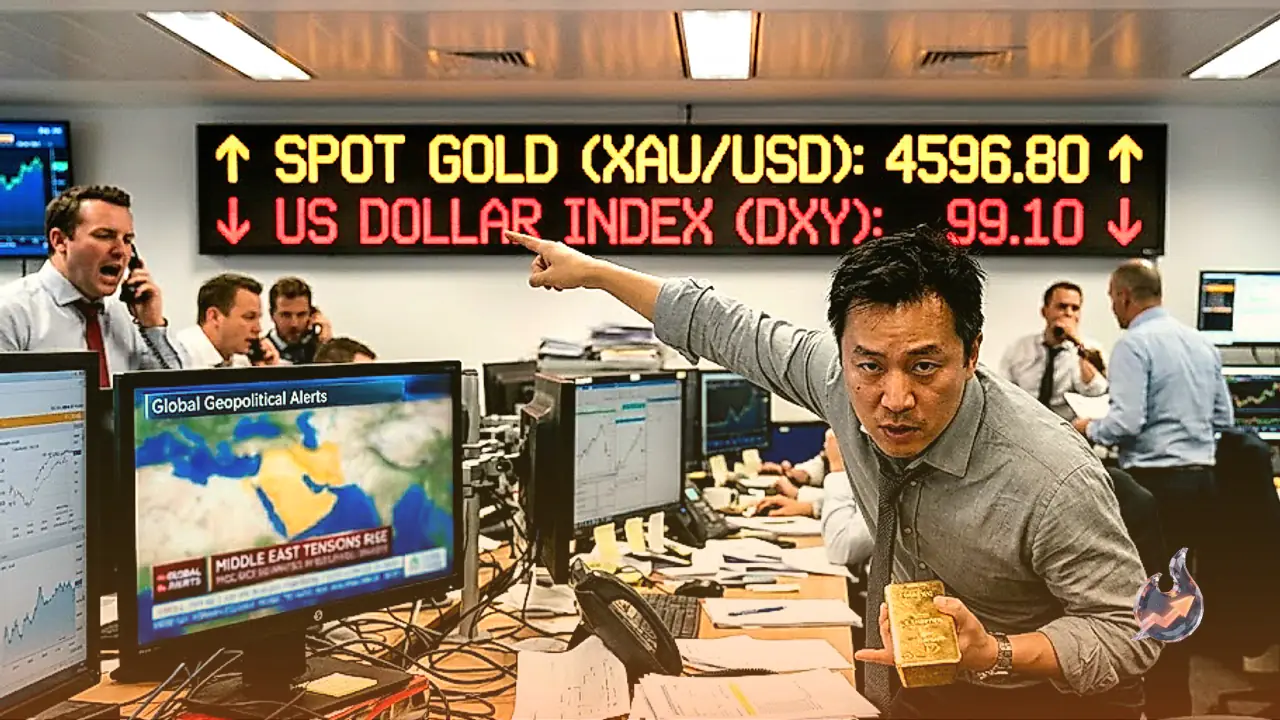

Gold has asserted strong upward momentum in global markets, reaching a fresh high near the $4,597 per ounce region after touching $4,544 during Asian trading hours. Building on its previous close of $4,516 with a 1.79 percent daily advance, the precious metal continues to benefit from soft sentiment surrounding the US Dollar, which remains pinned near a three-month low. Receding expectations for further interest rate hikes by the Federal Reserve have reinforced the bullish backdrop for bullion. Although elevated crude oil prices present persistent inflation risks that support US Treasury yields, overall technical structures for gold remain decidedly constructive.
Geopolitical Escalation in the Middle East Drives Safe-Haven Demand
Renewed friction between the United States and Iran around the Strait of Hormuz has injected a significant geopolitical risk premium into global asset pricing. Tensions expanded further as Yemen's Iran-backed Houthi group stated it targeted eight oil tankers following its declaration of a maritime blockade on Saudi shipping in late July. The prospect of a wider regional confrontation pushed crude oil to a three-week peak on Thursday. Rising energy costs have renewed market anxiety over sticky inflation, helping keep US bond yields elevated and partially offsetting US Dollar losses.
Fiscal Strain: $40 Trillion Debt Horizon and Treasury Liquidity Operations
The US financial system is closing in on a historic milestone as national debt nears the $40 trillion threshold. Market observers highlight this growing fiscal burden alongside vulnerabilities in the $1.4 trillion private credit market as potential structural risks for the broader economy. Responding to liquidity requirements in the sovereign debt market, the US Treasury Department departed from its standard schedule on Wednesday at 12:32 GMT to announce an expansion of its debt buyback program. Effective September 9 through November 4, the Treasury will double its liquidity support operations across 10-to-20 year and 20-to-30 year sectors, elevating the maximum cap per operation from $2 billion to at least $4 billion.
Technical Outlook: Fibonacci Retracements, Moving Averages, and Live Indicators
From a technical standpoint, holding firm above the 61.8 percent Fibonacci retracement at $4,529 paves the way toward the 78.6 percent level at $4,687, with the long-term cycle peak of $4,889 standing as the ultimate upside objective. On the downside, immediate support rests at $4,529.03, followed by the 200-day Simple Moving Average at $4,514.16 and the 50 percent retracement near $4,417. Deeper downside buffers are identified at the 38.2 percent retracement of $4,306.50, the 23.6 percent level at $4,168, and the structural floor anchored near $3,946.
Live market metrics show the 14-day Relative Strength Index (RSI) at 73, entering overbought territory. The Moving Average Convergence Divergence (MACD) indicator prints at 102.62 against a signal line of 69.88, reflecting strong bullish momentum. Trend indicators feature the 20-day EMA at $4,330, the 50-day EMA at $4,279, and the 200-day EMA at $4,316. Daily volatility, measured by the Average True Range (ATR), stands at 81.43. Key intraday pivot levels place central support-resistance at $4,588, with resistance targets at R1 $4,610 and R2 $4,622, alongside support boundaries at S1 $4,575 and S2 $4,553.
Foreign Exchange Dynamics: Cable Holds Steady, EUR/USD Retracts
The US Dollar exhibited mixed performance across major currency pairs, posting its strongest gains against the Japanese Yen. The GBP/USD pair held onto most of its daily advance, trading near the 1.3630 to 1.3620 range on Thursday despite a slight Greenback rebound, as traders awaited vital UK economic data. Meanwhile, EUR/USD gave up its early session gains to trade below 1.1700 due to late US Dollar buying. Investors across both continents are now positioning for upcoming preliminary S&P Global Manufacturing and Services PMI reports.