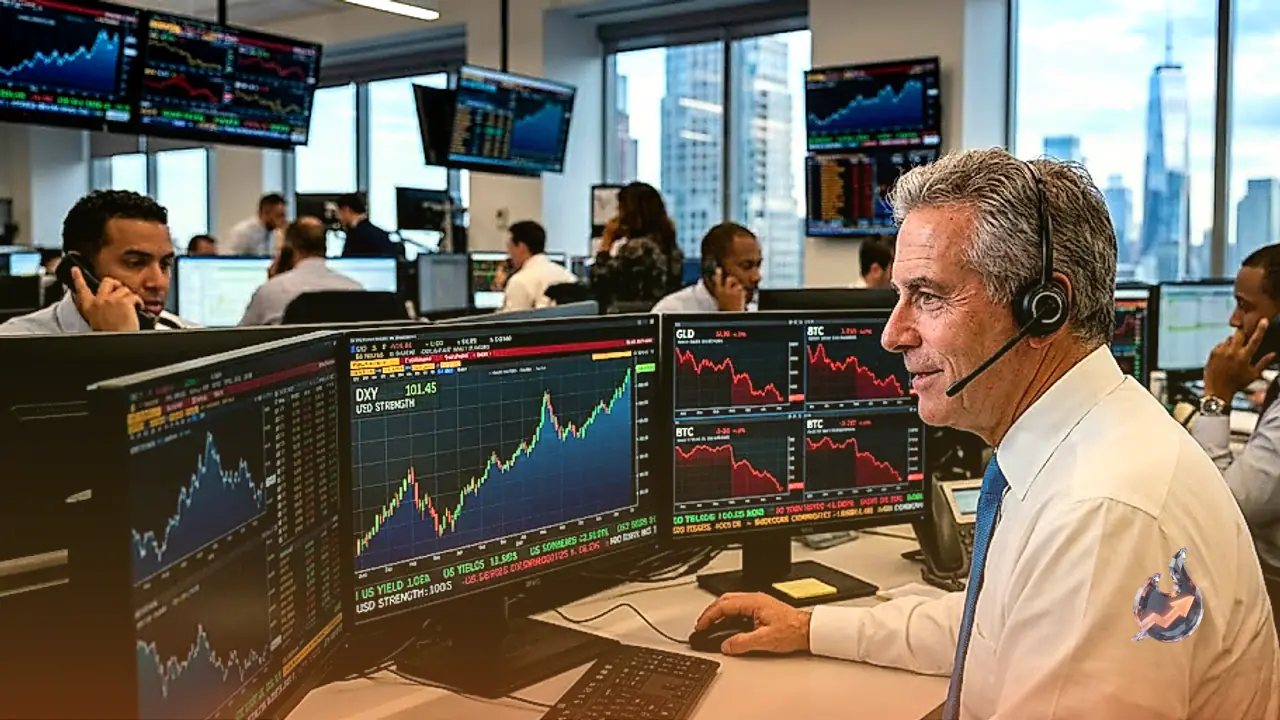

























The British Pound has come under notable selling pressure as the US Dollar regains broad momentum across global foreign exchange markets. With the US Dollar Index (DXY) advancing toward the 102.00 threshold, the GBP/USD currency pair slipped to trade around the 1.3203 handle. Resilient economic activity in the United States, marked by steady employment components and rising manufacturing orders, combined with mounting geopolitical frictions in the Middle East to draw substantial capital into safe-haven dollar holdings, leaving Sterling vulnerable to extended downside risks.
Resilient US Economic Indicators and Persistent Inflation Pressures
Recent macroeconomic prints from the United States underscored fundamental strength across core sectors. The ISM Manufacturing PMI for September came in at 54.5, slightly beneath the consensus projection of 55 and just a tenth below the 54.6 registered in August. However, key internal sub-components revealed solid underlying momentum. The new orders gauge expanded from 53.7 to 55.3, while the employment sub-index moved up from 51.2 to 52.7, indicating sustained hiring appetite and steady demand within domestic manufacturing pipelines.
At the same time, the ISM Prices Paid sub-component highlighted that pipeline price pressures remain elevated. The index jumped from 71.1 to 77.1, significantly beating expectations of 72.3. This surge signaled persistent production-side inflationary strains. Nevertheless, softer readings from the Federal Reserve's preferred inflation yardstick, the core Personal Consumption Expenditures (PCE) price index, led money market participants to scale back rate hike expectations. Data from Prime Terminal indicated that the probability of an interest rate increase at the October policy meeting declined from roughly 38% to 30%. Despite this cooling, elevated crude oil prices have kept benchmark yields historically high, with the 10-year US Treasury note edging down 1 basis point to 5.277%.
Geopolitical Escalation in the Middle East Lifts Safe-Haven Greenback
Investor sentiment across financial markets turned distinctly cautious as tensions between the United States and Iran showed no sign of imminent resolution. According to an account citing a US official, three aircraft carriers and two landing groups are scheduled to be deployed in regions surrounding Iran by late November. The prospect of military escalation supported crude oil prices and triggered strong demand for safe-haven assets.
The US Dollar Index, which gauges the greenback against a basket of six major currencies, climbed 0.47% to reach 101.94, positioning itself directly beneath the 102.00 barrier. Elevated sovereign debt yields, hovering near levels unseen since the 2000s, further reinforced the dollar's competitive yield advantage over international counterparts.
UK Political Developments and European Union Speculation
In the United Kingdom, a sparse domestic economic calendar left traders focused on political remarks delivered by Prime Minister Andy Burnham. During his speech, Burnham hinted at prospective adjustments to pensions and reintroduced the concept of a potential return to the European Union.
Addressing the market implications, ING strategist Chris Turner noted that foreign exchange markets would likely view such an initiative favorably, particularly given the memory of Sterling's severe depreciation following the 2016 Brexit referendum. Nevertheless, this political commentary failed to stem the British currency's broader decline against the ascending dollar. Daily currency performance tables indicated that while the British Pound held up as the strongest performer against the Euro, it struggled to maintain footing against the greenback.
GBP/USD Technical Structure and Critical Chart Levels
From a chart perspective, GBP/USD traded around 1.3203, retaining a pronounced bearish bias over the near term. The currency pair remains positioned cleanly beneath a dense cluster of overhead simple moving averages (SMAs) and violated trend lines. The 50-, 100-, and 200-day SMAs align in a triple moving average formation near 1.3455, establishing a formidable ceiling. Previous technical breakdowns below 1.3315 and 1.3435 have exposed the exchange rate to deeper losses, while the 14-day Relative Strength Index (RSI) hovered at 29.9, brushing oversold territory without confirming an outright bottom or trend reversal.
Live market metrics reflect that the pair is trading at 1.32, matching the prior close of 1.32 for a net daily change of -0.28%. Over the past 52 weeks, the range spans 1.30 to 1.38, with current trading volume matching 1.00 times its 20-day moving average. Technical indicators calculated from live data show the 14-period RSI at 28, deep in oversold conditions. The MACD stands at -0.01 against a signal line of -0.01 with a histogram of -0.00, confirming prevailing downward momentum. Moving averages display the 20-day EMA at 1.34, 50-day EMA at 1.34, and 200-day EMA at 1.34, alongside the 50-day SMA at 1.35 and 200-day SMA at 1.34. The 50-day EMA positioned below the 200-day EMA reflects a technical death cross within an active long-term downtrend. Bollinger Bands (20, 2) span 1.31 to 1.37 with a middle band at 1.34. The 14-period ADX registers 33, denoting an active trend, while Stochastic oscillators show a fast line of 3 against a signal line of 9. The 14-day Average True Range (ATR) sits at 0.01, highlighting daily volatility boundaries. Calculated support and resistance levels place the pivot at 1.32, initial resistance R1 at 1.33, secondary resistance R2 at 1.33, primary support S1 at 1.32, and secondary support S2 at 1.31. Overhead resistance starts at the former trend line around 1.3315, followed by the descending resistance line linked to the 1.3653 peak near 1.3435, the grouped daily SMAs at 1.3455, and higher levels at 1.3540 and 1.3742. Without defined nearby structural support below 1.3203, any prospective rebound is expected to face heavy corrective resistance.
Broader Foreign Exchange, Commodities, and Crypto Markets
Greenback strength reverberated through other major asset classes. The AUD/USD pair consolidated near a two-month trough in the mid-0.6900s during Asian trading. Although soft US PCE prints reduced odds of an aggressive Federal Reserve move, energy-linked price pressures sustained bond yields. Meanwhile, Australia's trade surplus contracted sharply to AUD 495 million in August, offering minimal directional impact on the Australian currency.
In Asia, USD/JPY held near the upper boundary of its weekly range above 158.00. Safe-haven inflows spurred by the US-Iran situation and elevated yields effectively countered speculation regarding Bank of Japan rate hikes or potential foreign exchange intervention by Tokyo authorities. Spot Gold (XAU/USD) traded cautiously around $4,167, posting a modest daily gain of 0.26%, as gains were constrained by strong dollar valuations and Treasury yields.
Cryptocurrency benchmarks experienced parallel consolidation. Bitcoin traded within a tight band bounded by support at $82,500 and resistance at $85,000. Ethereum remained under pressure beneath $2,700, with immediate floor support sitting at $2,600, while Ripple fell through its critical $1.50 baseline. Market sentiment regarding the Federal Reserve has shifted remarkably; whereas traders widely anticipated an October rate hike just one week prior, cooling inflation and prudent central bank commentary have transformed a policy pause into the consensus view. The upcoming US Nonfarm Payrolls release now stands as the critical benchmark that will dictate the next directional move for Sterling sellers.