























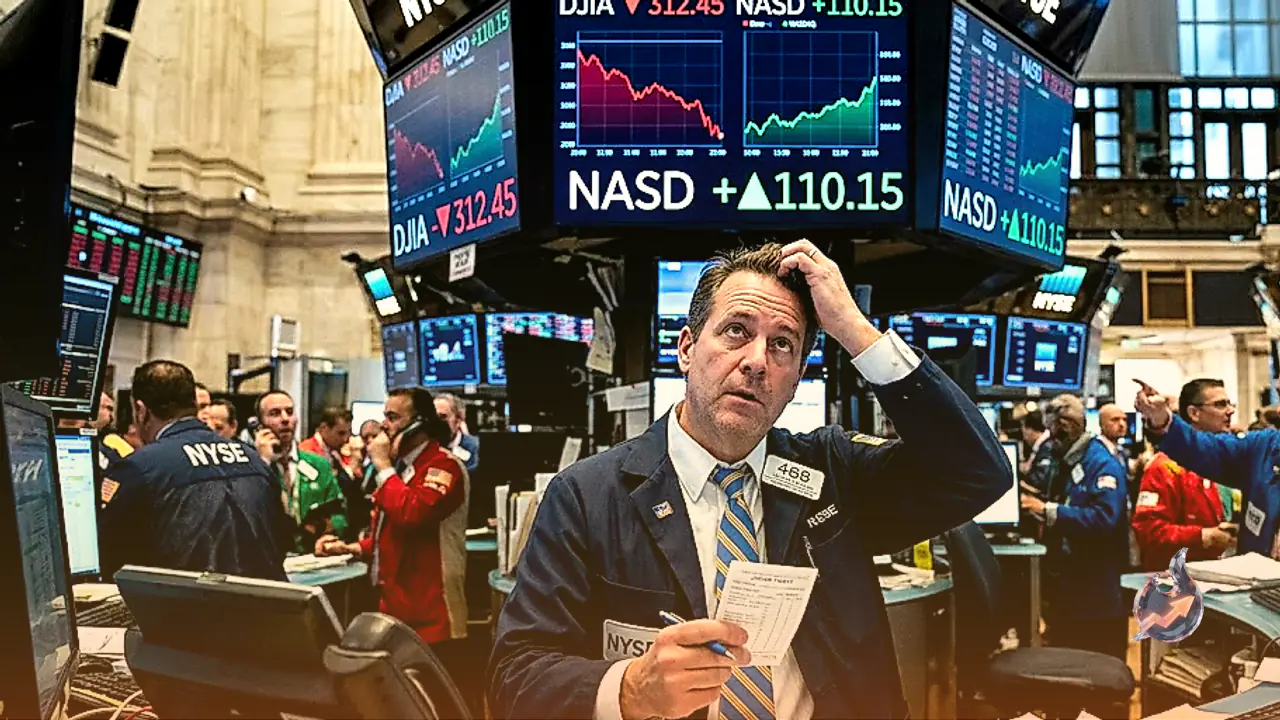

Wall Street exhibited sharp divergence on Tuesday as a steep pullback across financial institutions pulled the Dow Jones Industrial Average down from its recent peak. Prior to the opening bell in New York, the blue-chip index climbed to its strongest mark since September 14, only to reverse direction once regular trading commenced. The Dow drifted lower toward 51,800, slipping beneath Monday's settlement level. Meanwhile, robust demand for big technology names lifted the NASDAQ Composite to test fresh record highs, while the S&P 500 remained virtually unchanged. Capital actively rotated away from financial conglomerates and into the tech sector, leaving the Dow disadvantaged given its heavy weighting in banking and lighter footprint in software and hardware leaders.
The Mathematical Impact of Price-Weighting and Sector Rotation
The core explanation behind the contrasting performances of the major indices lies in the unique price-weighted methodology of the Dow Jones Industrial Average. Because index weight is determined purely by share price rather than market capitalization, a dollar movement in a higher-priced stock exerts a disproportionate impact on the headline figure. Goldman Sachs shares command a price exceeding $900, placing it among the costliest components within the index. In contrast, JPMorgan Chase trades under $400 per share. Even though JPMorgan boasts a market valuation more than three times larger than Goldman Sachs, a 1% decline in Goldman Sachs shaves more than twice as many points off the index total.
Compounding this dynamic is the fact that major tech powerhouses like Meta are entirely absent from the Dow roster. Consequently, when institutional capital rotates aggressively out of lending giants and floods into tech shares, the NASDAQ Composite easily records new highs while the Dow sinks under the pressure of tumbling financial heavyweights.
Crude Oil Slides for Fifth Day Amid Geopolitical Developments
Commodity markets also exerted a strong influence as crude oil extended its losing streak to a fifth consecutive trading session. International benchmark Brent crude touched its lowest quotation since September 8 following reports that Iran offered to restore normal maritime navigation through the Strait of Hormuz within seven days. That potential opening remains contingent on the United States removing its naval blockade of Iranian commercial ports, a condition that has not received independent verification.
A softening crude tape produces divergent consequences across the 30 corporate giants in the index. Chevron stands as the sole integrated oil producer tracked by the Dow, meaning lower commodity realizations directly pinch its earnings outlook. Conversely, cheaper fuel provides immediate cost relief to the other 29 constituent corporations by reducing logistics, transport, and manufacturing expenses.
Federal Reserve Monetary Policy and Tightening Credit Conditions
Broader investor sentiment continues to absorb the monetary policy trajectory set by the Federal Reserve. On September 16, the central bank lifted its benchmark overnight borrowing rate by a quarter-point to a target range of 3.75-4.00%, marking the first rate hike since July 2023. Sticky energy and fuel prices earlier in the season played a decisive role in prompting that policy tightening.
Commercial banks wasted no time in passing these funding costs along to the broader economy. On September 17, JPMorgan Chase raised its prime lending rate to 7.00% for its most creditworthy borrowers, directly inflating interest charges across corporate revolvers and consumer credit facilities. Financial market participants are now bracing for the Federal Reserve's next interest rate determination scheduled for October 28, which arrives just six days ahead of the November 3 midterm elections. Around that political calendar, Donald Trump indicated expectations that a diplomatic accord with Iran could materialize shortly after the midterm vote concludes.
Key Technical Chart Boundaries: Support and Resistance
From a chart perspective, the technical structure of the Dow has identified clear resistance and support lines. Prior to Tuesday's opening, the index pushed past both its September 17 and Monday highs slightly above 52,100, but immediately dropped back underneath once trading started, establishing that zone as primary overhead resistance. Further above, Tuesday's intraday peak just over 52,400 represents the highest print since September 14 and marks the level where the morning rally exhausted itself.
On the downside, Tuesday's low just under 51,800 aligned with Monday's trough just above 51,750, marking the second consecutive trading session where selling halted around that shelf. Should this immediate floor give way, technical support shifts down toward the September 18 low just below 51,500. A deeper breakdown would bring the September 16 low near 51,200 into focus, which marks the lowest recorded price level since June.
Momentum Indicators and Prevailing Technical Bias
Technical indicators indicate a short-term bearish bias as long as the index remains beneath the 52,100 threshold. Under this setup, immediate downside objectives point to the September 18 low beneath 51,500, followed by the September 16 marker near 51,200. The daily Stochastic Relative Strength Index (Stoch RSI) sits around 22, having declined persistently over the past two weeks without demonstrating an upward reversal hook. This bearish outlook would only be invalidated if the index manages a daily closing session above 52,200.
Live market data at the closing bell shows the Dow Jones (^DJI) trading at $51,787, retreating 0.50% from its previous close of $52,049 within a 52-week band of $45,057 to $54,744. Session trading volume ran light at 0.41 times the 20-day average. The daily 14-period RSI stands at 41, while the MACD measures -363.66 against a signal line of -246.48, generating a negative histogram of -117.18. Moving averages remain constructively tiered over the broader horizon, with the 20-day EMA at $52,445, the 50-day EMA at $52,525, and the 200-day EMA down at $50,303 alongside an active golden cross configuration. The Bollinger bands span between $51,231 and $54,106 with a middle line at $52,668, keeping price securely within the channels. Average true range volatility is 510.13, while pivot levels place primary resistance R1 at $52,162 and R2 at $52,537 against support S1 at $51,569 and S2 at $51,351 around a central pivot of $51,944.
Foundational Architecture of the Dow and Dow Theory Principles
Formulated by Charles Dow, who also founded the Wall Street Journal, the Dow Jones Industrial Average represents one of the most storied equity benchmarks globally. Rather than tracking broader capitalization, it tallies the share prices of 30 premier US industrial and commercial blue-chips, dividing the aggregate sum by a mathematical factor currently sitting at 0.152. Over decades, market observers have criticized the index for its narrow scope relative to broad market benchmarks like the S&P 500, noting that 30 hand-selected companies cannot fully capture the breadth of the modern American corporate landscape.
The benchmark's performance is governed by quarterly earnings updates across its 30 constituents, macroeconomic data prints, and prevailing interest rate regimes set by the Federal Reserve. It also gave rise to classic Dow Theory, a disciplined trend-following methodology where a valid market trend requires mutual confirmation between the Dow Jones Industrial Average and the Dow Jones Transportation Average moving in the same direction alongside supporting trading volume. Dow Theory categorizes market movements into three primary phases: accumulation, where institutional capital quietly positions; public participation, where retail volume enters the trend; and distribution, where informed capital locks in gains and exits positions.
Modern investors interact with the index via multiple investment vehicles. Rather than purchasing all 30 underlying equities individually, market participants frequently utilize exchange-traded funds such as the SPDR Dow Jones Industrial Average ETF (DIA). Derivatives traders actively employ futures contracts for directional hedging and leverage, while index options provide defined-risk strategies, and diversified mutual funds offer broader passive exposure.
Global Macro Developments: Central Banks, Currencies, and Gold
Cross-asset dynamics across international trading desks presented their own significant macro shifts. In Asia, the Bank of Japan lifted its short-term policy interest rate target from 1.00% to 1.25% in a 7-2 vote. While representing an advance in policy normalization to a 31-year peak, the hike met broad consensus expectations, keeping USD/JPY hovering around 157.50 as currency intervention warnings offset yen weakness.
Elsewhere in foreign exchange, AUD/USD found buying interest above 0.7100 during the Asian session following hawkish remarks from Reserve Bank of Australia Assistant Governor Sarah Hunter and Governor Michele Bullock, though broader dollar resilience and Middle East tensions capped gains. Spot gold slipped for a second consecutive session toward $4,300 per troy ounce, weighed down by renewed greenback accumulation and mixed US Treasury yields. Meanwhile, global market participants look ahead toward the high-stakes diplomatic summit between US President Donald Trump and Chinese President Xi Jinping in Washington this Thursday, an encounter expected to set the near-term course for bilateral economic relations.