
























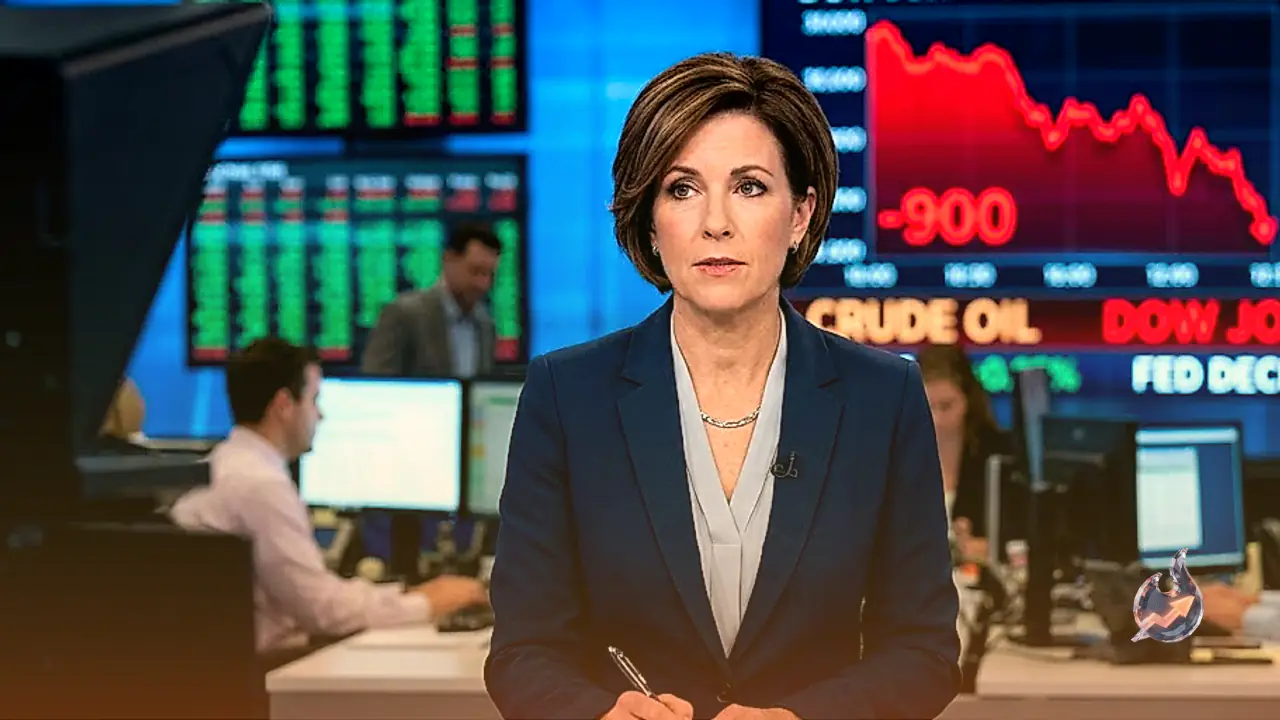

Wall Street equities faced intense selling pressure on Wednesday afternoon just hours before the Federal Reserve was scheduled to deliver its benchmark interest rate decision. The Dow Jones Industrial Average plunged by approximately 900 points, or 1.7%, sliding back below the key 52,000 threshold to trade near 51,800. This pullback erased gains made earlier in the week when peace optimism had temporarily lifted the index. After recording a session high above 52,800 before 09:00 GMT, the market moved steadily downward throughout the day. According to live market metrics, the Dow Jones closed near $51,980, marking a 1.45% decline from the previous session's close of $52,747.
Surge in Crude Oil Prices Following Unexpected Inventory Draw
Adding to market jitters, official energy data revealed a sharper-than-expected contraction in US crude inventories. The Energy Information Administration (EIA) reported a draw of 7.167 million barrels in commercial crude oil stocks for the week at 14:30 GMT. This figure significantly exceeded the consensus estimate of a 2.5 million barrel draw and stood in contrast to the prior week's build of 2.011 million barrels. Analysts noted that a reduction of this magnitude indicates physical supply constraints linked to global trade bottleneck disruptions rather than routine refinery maintenance. Following the report, crude oil prices jumped nearly 7% to hover near $90.00 per barrel.
Federal Reserve Policy Considerations and Chair Warsh's Press Conference
The sudden surge in energy prices complicates the macroeconomic backdrop for Federal Reserve policymakers. Having raised its 2026 inflation projection from 2.7% to 3.6% in June due to persistent energy price pass-through into petrochemicals, fertilizers, and food products, the Federal Open Market Committee (FOMC) faces renewed inflationary pressure with crude trading near $90.00. Adding to the uncertainty, the July meeting does not feature an updated Summary of Economic Projections (SEP) or dot plot. With the June policy statement having been streamlined to roughly 130 words, market participants are looking to Chair Warsh's 18:30 GMT press conference for guidance on monetary policy trajectory. While nine out of 18 policymakers had indicated a potential rate hike for 2026 in the June dot plot, the decision to hold rates had remained unanimous.
Semiconductor Sell-off and Key Corporate Earnings Updates
Technology and semiconductor shares led the broader market decline. The benchmark chip exchange-traded fund dropped over 4% during the session, bringing its weekly loss to 10% across four consecutive negative sessions amid concerns surrounding artificial intelligence capital expenditures and rising Chinese competition. Among individual chipmakers, Micron (MU) fell 5%, Advanced Micro Devices (AMD) declined more than 5%, and KLA (KLAC) dropped over 8%. Broad market indices also pulled back, with the S&P 500 falling 0.9% and the Nasdaq Composite slipping 1.2%. Because the Dow Jones is a price-weighted index and counts Nvidia (NVDA) as its sole semiconductor component, the index was primarily dragged down by rate-sensitive industrial and consumer conglomerates. Procter & Gamble (PG) declined more than 3% following a revenue shortfall, whereas Ford (F) gained 5% after beating quarterly expectations and raising its full-year outlook.
Incoming Macroeconomic Data Releases
Traders are also monitoring a crucial cluster of economic releases scheduled for Thursday at 12:30 GMT, including the June Personal Consumption Expenditures (PCE) deflator, advance second-quarter Gross Domestic Product (GDP) growth figures, and weekly initial jobless claims. Consensus expectations point to headline PCE of -0.1% month-over-month (MoM) and 3.7% year-over-year (YoY), down from 4.1%. Core PCE is anticipated at 0.2% MoM and 3.3% YoY. Annualized GDP growth is expected at 2.1%, while initial jobless claims are projected to rise to 200,000 from 187,000. However, because the June PCE data reflects a period when gasoline prices declined nearly 10%, analysts note that upcoming metrics such as Friday's Employment Cost Index (consensus 0.8%) and the Michigan one-year inflation expectation series (4.2%) may offer a more relevant signal for the Fed's September meeting.
Technical Support, Resistance, and Chart Indicators
From a technical standpoint, the 52,000 level for the Dow Jones has shifted from a key support floor to immediate resistance. Above this level, resistance is identified near Tuesday's close of 52,750 and the session peak of 52,800, with the all-time high above 53,300 standing as major resistance. On the downside, immediate support rests at the session low near 51,800, followed by the 50-day Exponential Moving Average (EMA) near 51,500. A break below that line opens up the 51,000 psychological level, with the 200-day EMA positioned near 49,000. Live indicators show a 14-day RSI of 49 and a bearish MACD histogram of -88.11. The index remains within its 52-week trading range of $43,341 to $53,289. Daily Stochastic RSI readings near 18 reflect oversold conditions, signalling persistent downward momentum.
Fundamentals of the Dow Jones Industrial Average and Dow Theory
The Dow Jones Industrial Average is one of the oldest equity benchmarks globally, originally established by Wall Street Journal founder Charles Dow. Comprising 30 major blue-chip US corporations, the index utilizes a price-weighted calculation method where component stock prices are summed and divided by a designated divisor (currently 0.152). Index movements are driven by corporate earnings reports, macroeconomic indicators, and Federal Reserve interest rate policy, which affects corporate borrowing costs. Under classic Dow Theory, primary market trends are validated when both the Dow Jones Industrial Average and the Dow Jones Transportation Average move in tandem with confirming volume. Dow Theory identifies three primary trend phases: accumulation by institutional investors, public participation, and distribution. Investors access index exposure through financial instruments including the SPDR Dow Jones Industrial Average ETF (DIA), index futures, options contracts, and mutual funds.
Broader Market Movements: Currencies, Commodities, and Crypto
In adjacent markets, currency and commodity asset classes traded cautiously amid US Dollar stability ahead of the Fed announcement. The GBP/USD pair traded defensively near multi-week lows around 1.3280 as traders awaited Thursday's Bank of England (BoE) policy meeting. The EUR/USD pair held within a tight consolidation range below 1.1400 amidst geopolitical tensions in the Middle East. Gold held slightly above the psychological $4,000 per troy ounce mark. In digital assets, major cryptocurrencies remained under pressure, with Bitcoin (BTC) dropping below key support levels, Ethereum (ETH) testing resistance, and Ripple (XRP) drifting toward the $1.00 support level.


