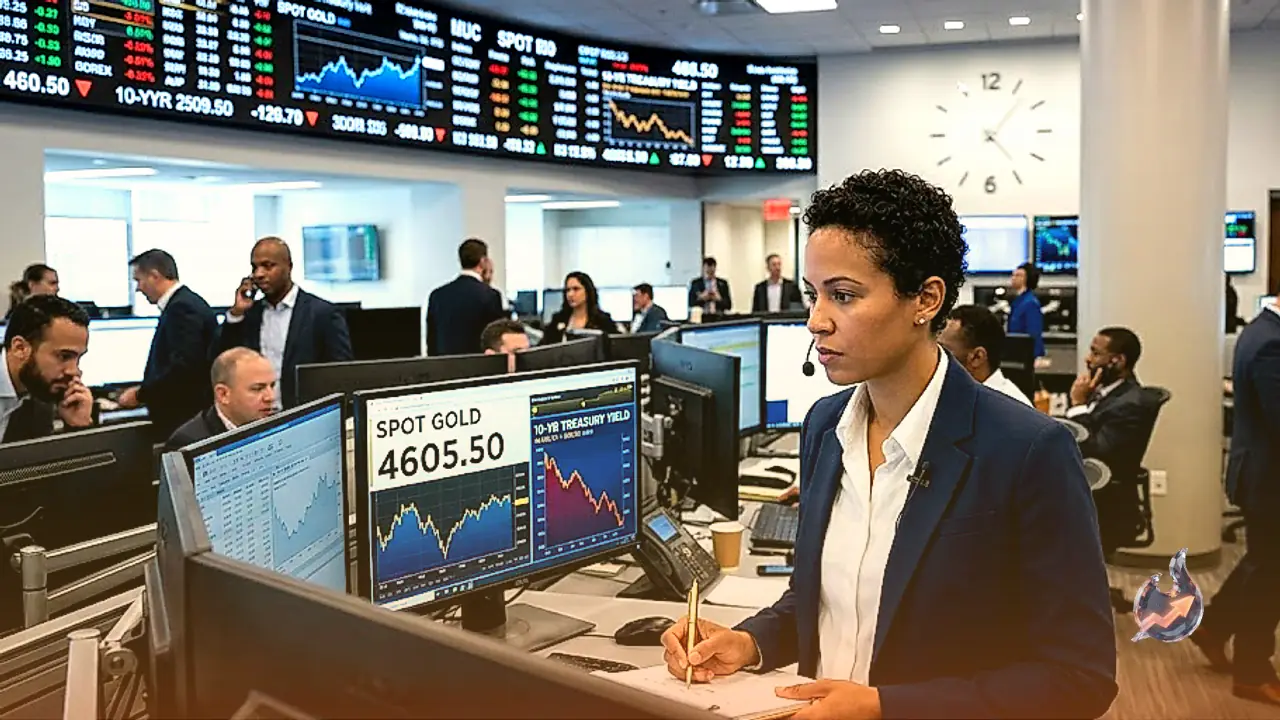
























Precious metals markets have resumed their upward trajectory as strong risk sentiment across global equity markets caps gains in the US Dollar. Spot Gold (XAU/USD) built solid traction above the $4,600 threshold, advancing to around $4,663 per troy ounce. Following a previous close of $4,598, the yellow metal recorded a 1.40% daily gain. Market participants are positioning themselves ahead of highly anticipated remarks from Federal Reserve Chair Kevin Warsh at the Jackson Hole Economic Symposium.
Technical Structure: 4-Hour and Daily Chart Analysis
Technical parameters across multiple timeframes suggest that gold remains anchored within a structural uptrend. On the 4-hour chart, XAU/USD trades comfortably above both its 100-period Simple Moving Average (SMA) at $4,449.40 and its 200-period SMA at $4,254.05. Although price action momentarily consolidated beneath the 20-period SMA at $4,630.83, buyers successfully absorbed the overhead supply. Both the Relative Strength Index (RSI) and Momentum indicators on the 4-hour chart reflect balanced market conditions, signaling sustained buying interest rather than exhaustion.
The daily chart reinforces this bullish posture. Gold is trading well above its 200-day SMA at $4,525.26, while the 20-day and 100-day SMAs align at $4,390.47 and $4,376.46 respectively. The daily 14-day RSI hovers near 67, highlighting constructive underlying momentum. Live technical readings place the 14-period RSI at 72 in overbought territory, accompanied by a bullish MACD reading of 128.29 against its signal line of 101.85. Key short-term Exponential Moving Averages sit at $4,433 (EMA20) and $4,333 (EMA50). Near-term technical resistance is pinned at $4,702 (R1) and $4,740 (R2), with immediate support located at $4,620 (S1) followed by $4,577 (S2). The asset's 52-week trading range spans between $3,382 and $5,586.
Corporate Performance and Macroeconomic Backdrop
Providing broader market support, recent corporate financial disclosures revealed strong operational metrics. Corporate revenues surged to $96.22 billion, outperforming market forecasts of $92.17 billion and effectively doubling Q2 2025 results. Net income similarly doubled compared to the prior-year period, reaching $53.95 billion, or $2.22 per share, up from $1.87 per share a year ago. Forward guidance indicates sales for the upcoming quarter are projected to cross the $100 billion mark and potentially top $108 billion. This robust earnings performance bolstered equity markets and trimmed defensive flows into the US Dollar.
Foreign Exchange Trends: GBP and EUR Rebates
In foreign exchange trading, major currency pairs stabilized as the Greenback struggled to establish clear directional bias. GBP/USD recovered from fresh six-day lows to trade just below the 1.3600 resistance barrier. Caution remains prevalent among traders anticipating upcoming macroeconomic releases and central bank commentary.
EUR/USD trimmed earlier session losses to reclaim the mid-1.1600 zone. Currency markets are awaiting the upcoming Non-Farm Payrolls (NFP) revision figures and Chairman Warsh's scheduled address at Jackson Hole. The absence of aggressive US Dollar buying has created a favorable environment for gold to maintain its higher price floor.
Digital Assets and Energy Sector Developments
Cross-asset dynamics show widespread gains across speculative channels. In cryptocurrency markets, Bitcoin advanced toward the $80,000 mark. Altcoins reflected this positive movement, with Ethereum holding above $2,500 and Ripple maintaining stability above its critical $1.40 support level.
In energy markets, diesel spreads signaled significant tightening despite relative calm in benchmark crude prices. The US diesel crack spread—measuring the margin between ultra-low sulphur diesel futures and WTI crude—crossed $100 per barrel for the first time on record, setting an intraday high of $102.00 per barrel. This surge in refining margins underlines persistent structural demand for middle distillates.
Jackson Hole Outlook and Monetary Policy Expectations
Global financial markets remain focused on the Jackson Hole Symposium, where Kevin Warsh will deliver his inaugural address as Federal Reserve Chair. Investors are seeking clarity not only regarding potential interest rate decisions at the September FOMC meeting but also on the central bank's medium-term inflation outlook and balance sheet strategy. Until these policy signals are delivered, gold is expected to maintain its trading range between key support near $4,600 and overhead resistance approaching $4,700.