
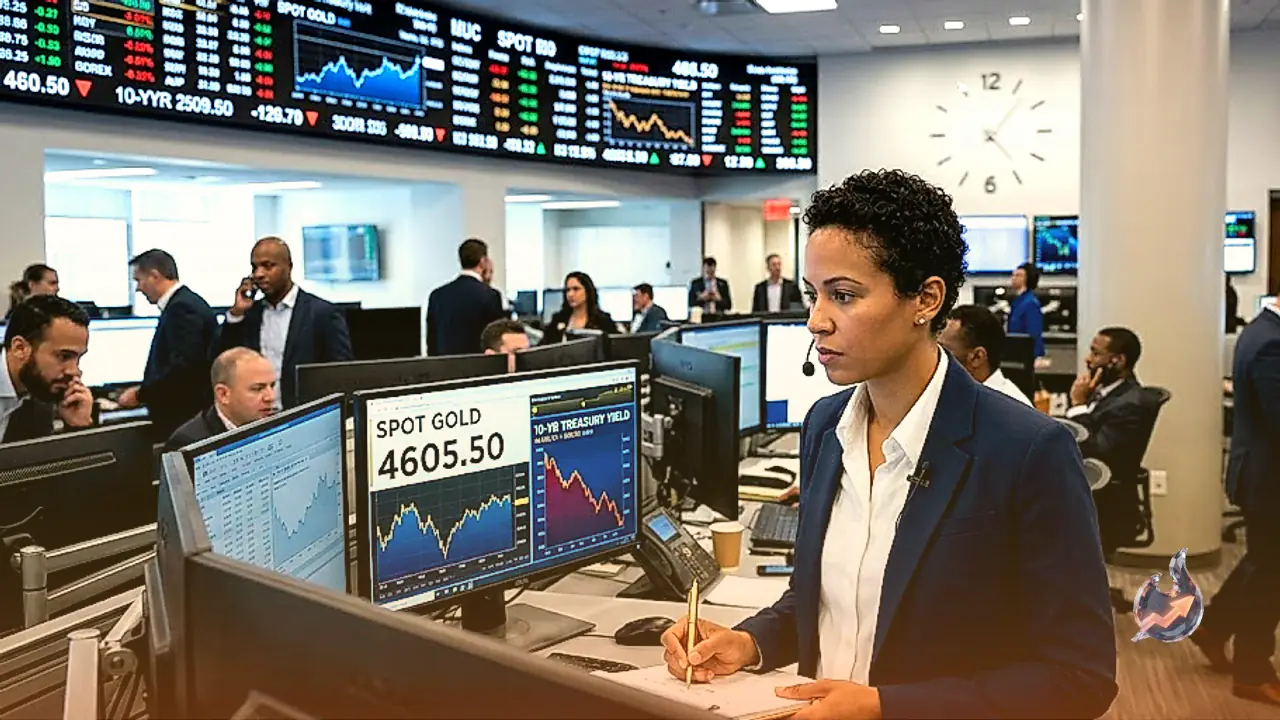























Gold prices continue to push higher in global trading, keeping bullion comfortably anchored above the critical $4,600 per ounce benchmark. Lower US Treasury yields have provided essential support for the precious metal, neutralizing tight monetary policy signals coming from Federal Reserve officials. Despite the bullish undertone, gold remains slightly cautious ahead of retesting weekly high marks near $4,697. Live market data shows spot gold trading at $4,665 per ounce, representing a 1.45 percent gain over its previous close of $4,598, with trading volume reaching 17.58 times its 20-day average. Market participants are balancing technical momentum against incoming macroeconomic signals from Washington.
Federal Reserve Officials Maintain Hawkish Stance on Inflation
A chorus of Federal Reserve policymakers has reinforced concerns regarding persistent inflationary pressures in the United States economy. Cleveland Fed President Beth Hammack emphasized that immediate action is required given the ongoing persistence of price growth. Kansas City Fed President Jeffrey Schmid similarly described inflation as remaining stubborn and sticky, emphasizing that rate cuts must be considered carefully. Adding to the unified tone, Chicago Fed President Austan Goolsbee highlighted inflation control as his top priority.
These hawkish assessments arrive amidst trade data revealing expanded economic imbalances. Figures from the US Census Bureau show the nation's trade deficit widened significantly from $102.1 billion to $118.8 billion in July. Furthermore, recent Core Personal Consumption Expenditures (PCE) readings show that underlying inflation remains well above the Federal Reserve's official 2 percent target, limiting the central bank's scope for rapid policy easing.
Spot Gold Technical Analysis and Key Price Levels
From a technical standpoint, gold's price action exhibits strong structural support paired with elevated momentum metrics. On the upside, the primary barrier sits at the psychological $4,650 level, followed by secondary resistance at $4,700. A clean breakout above this ceiling could open the path toward May 7 high of $4,764. Technical indicators show a 14-day Relative Strength Index (RSI) of 73, signaling overbought territory, while the Moving Average Convergence Divergence (MACD) stands at 128.48 against a signal line of 101.88, reflecting solid bullish momentum.
Conversely, initial downside support is established at $4,600 per ounce. A decline below this mark would bring the August 24 low of $4,594 into focus. Should daily price action close underneath $4,594, the path opens toward the 200-day Simple Moving Average (SMA) located at $4,376, ahead of additional support levels at the August 19 swing low of $4,324 and $4,300. The Average True Range (ATR) indicates daily volatility of $75.14, while key pivot parameters place R1 at $4,703, R2 at $4,741, S1 at $4,622, and S2 at $4,578.
Jackson Hole Outlook and Kevin Warsh's Expected Speech
Investor attention is overwhelmingly focused on Federal Reserve Chair Kevin Warsh's upcoming presentation at the Jackson Hole Symposium. Given Warsh's historical skepticism regarding explicit forward guidance, market participants will scrutinize every phrasing regarding economic performance for subtle hints regarding the future trajectory of interest rates.
The US economic calendar for Friday features several high-impact releases alongside Warsh's speech, including the University of Michigan Consumer Sentiment index and the Nonfarm Payrolls (NFP) benchmark revision. Meanwhile, the US Dollar Index (DXY), which measures the greenback against a basket of six major currencies, holds firm around 99.14 following resilient economic data releases earlier in the week.
Fundamental Drivers of Gold as a Safe-Haven Asset
Gold occupies a unique position in global finance as a store of value and reliable medium of exchange. Beyond industrial application and jewelry demand, bullion functions primarily as a premier safe-haven asset during periods of financial uncertainty or geopolitical stress. Because gold carries no counterparty risk and relies on no central sovereign authority, investors turn to the metal as a primary hedge against inflation and fiat currency devaluation.
Central banks represent the world's largest institutional gold holders. To diversify reserves and enhance trust in national currency stability, official monetary authorities aggressively acquire gold. Data compiled by the World Gold Council shows central banks added 1,136 tonnes of gold valued at approximately $70 billion to their vaults in 2022, marking the highest annual net purchase on record. Emerging market central banks, particularly those of China, India, and Turkey, continue to expand their official gold holdings rapidly.
Inter-Market Correlations: US Dollar, Rates, and Equities
Gold exhibits an inverse correlation with both the US Dollar and US Treasury yields. When the dollar weakens or real yields decline, holding non-yielding gold becomes relatively more attractive to international investors. Similarly, gold tends to move inversely to risk assets like equity markets. Broad stock market rallies often divert capital away from gold, whereas equity sell-offs generate increased inflows into precious metals.
Interest rate decisions directly influence bullion dynamics. As an asset that pays no yield or dividend, gold benefits when prevailing interest rates fall, reducing the opportunity cost of holding metal. Conversely, higher capital costs generally exert downside pressure on gold. However, because gold is priced in dollars on global exchanges (XAU/USD), dollar strength remains the predominant daily driver of metal price action.
Foreign Exchange Dynamics: GBP/USD and EUR/USD
Broader currency markets displayed modest recovery patterns on Thursday. The British Pound (GBP/USD) recovered from six-day lows to trade just under the 1.3600 handle, supported by underlying caution across global markets ahead of Friday's monetary announcements.
Simultaneously, the Euro (EUR/USD) managed to trim earlier session losses, reclaiming mid-1.1600 territory. The currency pair's resilience occurred despite marginal strength in the US dollar, as traders repositioned portfolios ahead of the NFP benchmark revisions and the Jackson Hole address.
Cryptocurrency Trends and Energy Market Surge
Digital currency markets trended upward on Thursday, led by Bitcoin's advance toward the $80,000 milestone. Altcoins tracked Bitcoin's gains, with Ethereum maintaining levels above $2,500 and Ripple holding firmly above key support at $1.40.
In contrast, the energy sector signaled localized tightness as the US diesel crack spread, representing the premium of ultra-low sulfur diesel futures over WTI crude, surged past $100 per barrel for the first time, reaching a historic intraday record of $102.00 per barrel. This spread highlights persistent refining bottlenecks and supply constraints in middle distillate fuels.