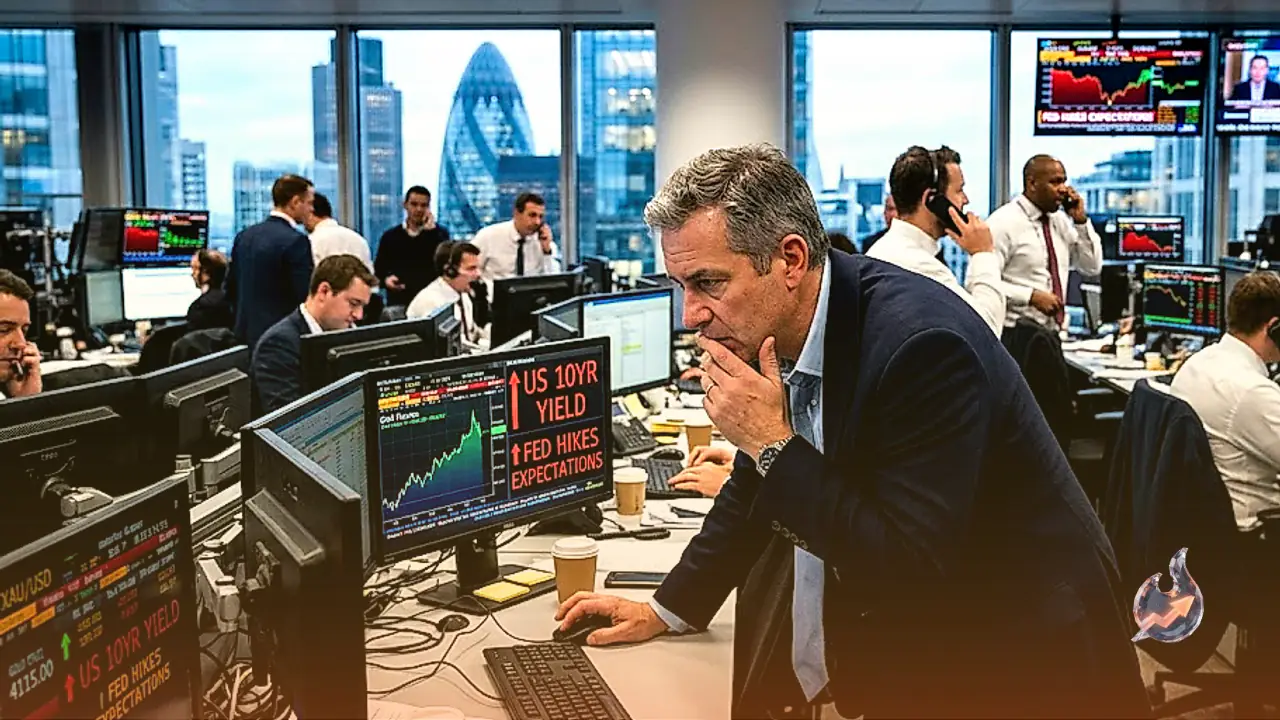

























Gold experienced downward momentum during Tuesday's early Asian trading session, with spot prices retreating toward $4,125 per ounce. The pullback comes against a backdrop of escalating crude oil prices and surging US Treasury bond yields, two factors that have collectively bolstered expectations for further interest rate hikes from the Federal Reserve. With higher yields elevating the opportunity cost of holding non-yielding precious metals, market participants are exercising caution as they await an incoming batch of crucial US labor market numbers and inflation readings later this week.
Surging Treasury Yields and Energy Market Pressures
The latest slide follows an aggressive decline in the previous session, during which the yellow metal tumbled by more than 4% to tap $4,110, marking its lowest price point since August 5. The selloff accelerated as benchmark 10-year US Treasury yields jumped to their highest levels since June 2007, before trimming some of those sharp advances. Concurrently, climbing energy prices have injected fresh complexity into financial markets. Higher oil prices tend to elevate transportation and production costs throughout the wider economy, thereby fueling inflationary pressures. While bullion traditionally serves as an established hedge against currency debasement and rising consumer prices, elevated interest rates diminish its relative appeal by making interest-bearing fixed income assets far more lucrative.
Tim Waterer, chief market analyst at KCM Trade, addressed the prevailing macroeconomic headwind, stating, "The high bond yields and high oil price tandem continue to act as a thorn in gold’s side." Waterer further noted that oil prices have appreciated following contradictory signals surrounding supply routes, which has effectively kept inflation considerations front and centre for international investors.
Middle East Tensions and Diplomatic Stalemate
Geopolitical friction continues to influence the energy corridor. Iranian officials stated that only diplomacy can resolve the ongoing conflict involving the US and Israel. This statement followed remarks from US President Donald Trump, who declared that he rejected an Iranian proposal intended to reopen the Strait of Hormuz and bring an end to the war. The resulting uncertainty across key shipping lanes has prevented crude prices from easing, reinforcing market projections that the Federal Reserve may feel compelled to maintain a restrictive policy path to rein in price pressures.
Providing further perspective on the precious metal complex, analysts at Deutsche Bank pointed out that bullion faced renew downward momentum last week, registering a decline of "-2.14% (+0.23% Friday), as higher real and nominal yields put downward pressure on precious metals as a non-interest-bearing asset." Deutsche Bank noted that while a minor weekend bounce helped cushion the latest decline, the overarching movement demonstrates bullion's ongoing vulnerability whenever real and nominal yields advance.
Daily Chart Technical Structure and Momentum
On the daily technical charts, XAU/USD retains a distinct near-term bearish posture. The price continues to trade beneath its 100-day simple moving average (SMA) as well as below the middle boundary of the Bollinger Bands. Furthermore, bullion has dropped below the latest Bollinger lower band, reflecting persistent selling activity across short-term horizons. The 14-period Relative Strength Index (RSI) is hovering near 35, remaining slightly above the oversold barrier and pointing toward stretched yet persistently weak technical momentum.
Regarding upward levels, the initial hurdle for any counter-trend move emerges at the Bollinger lower band near $4,190. Beyond that zone, stronger resistance rests at the 100-day SMA around $4,300 and the Bollinger middle band at $4,335, where a confirmed breakout could begin to relieve prevailing bearish constraints. A more substantial recovery would subsequently encounter resistance near the Bollinger upper band at $4,480. Only an established and sustained push above that higher threshold would suggest that XAU/USD is breaking free from its immediate downward trajectory.
Current Live Market Data and Key Thresholds
Current live market data from the close-bell session shows Gold (GC=F) trading at $4,163, down $5 or -0.14% from its previous close of $4,168. Over the trailing 52-week timeframe, the asset has oscillated between $3,786 and $5,586, with trading volume standing at 0.15 times its 20-day average. Live technical indicators show the 14-period RSI at 33, while the MACD sits at -49.61 against a signal line of -18.95, resulting in a bearish histogram reading of -30.66. Across moving averages, the 20-day exponential moving average (EMA) is located at $4,351, the 50-day EMA is at $4,366, and the 200-day EMA sits at $4,437, alongside a 50-day SMA of $4,360 and a 200-day SMA of $4,555. The structural death cross between the 50-day and 200-day EMAs underscores a prevailing long-term downtrend.
Bollinger Bands (20,2) span from $4,195 to $4,552 with a centerline at $4,373, leaving the current market quote beneath the lower envelope. The 14-day ADX sits at 18, indicating a relatively weak or ranging trend strength, while the Stochastic oscillator displays a fast line of 6 and a signal line of 12. The 14-day Average True Range (ATR) stands at 98.03, defining the expected daily price volatility buffer. On horizontal parameters, 20-day support is located near $4,143 while resistance aligns around $4,559. For active trading boundaries, the central pivot is calculated at $4,160, with resistance levels R1 at $4,174 and R2 at $4,186, countered by downside support thresholds at S1 of $4,148 and S2 at $4,133.
Foreign Exchange Dynamics and Global Central Bank Stance
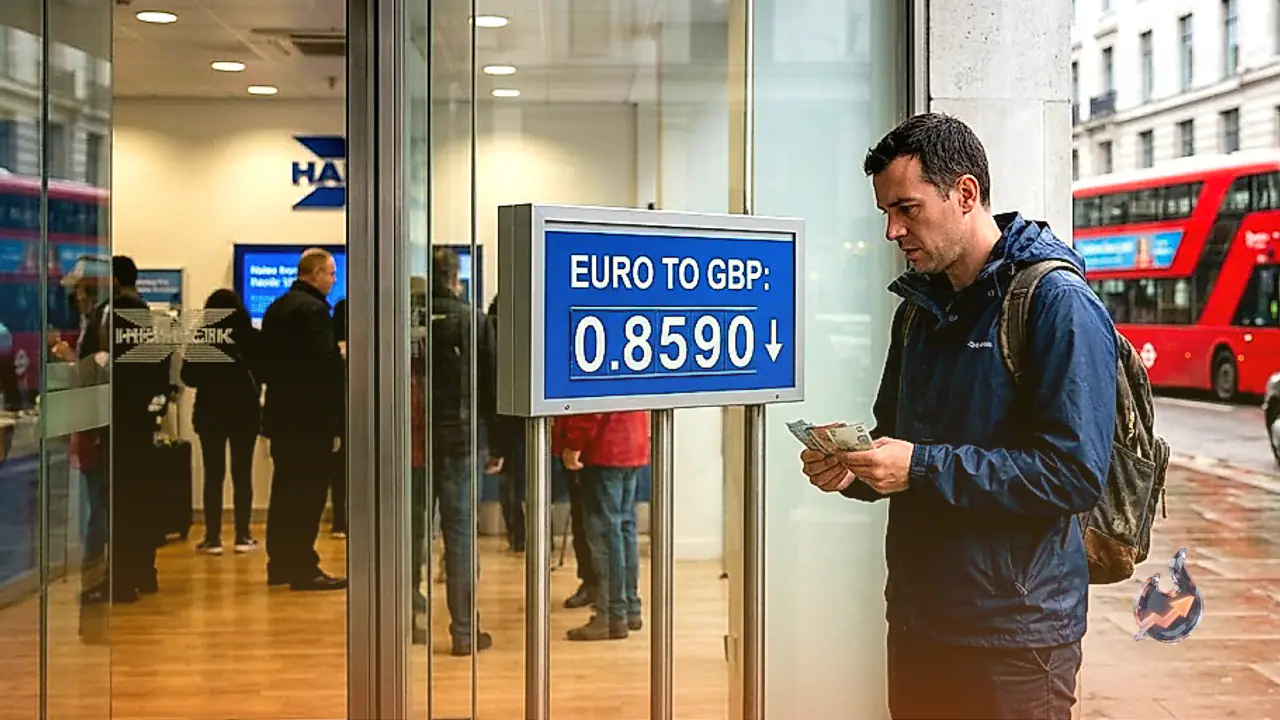
Shifting market sentiment has also triggered significant reallocations across foreign exchange and sovereign debt markets. Diminishing hopes for an immediate US-Iran peace resolution weakened broader investor confidence, dampening US equity markets while supporting Treasury yields. Consequently, the Australian Dollar dipped 0.10% against the US Dollar to trade near 0.7016, with trading activity remaining subdued ahead of the upcoming Reserve Bank of Australia monetary policy announcement. Concurrently, the USD/JPY currency pair attracted buyers on dips, rebounding from Friday's slide which had been driven by expectations of official intervention by Japanese authorities to support the Yen. However, dovish meeting minutes from the Bank of Japan limited Yen upside, while firm crude prices and growing bets on an October Fed rate hike revitalized the Greenback, guiding the pair back toward the 158.00 region.
In Europe, diesel prices in the United Kingdom reached a record high, accentuating economic challenges across consumer and industrial sectors. Although immediate crude supply anxieties experienced slight relief, overall energy costs remain elevated. From a global monetary perspective, both the Federal Reserve and the Bank of Japan implemented 25 basis point interest rate increases during their prior meetings, with both central banks confronting stubborn inflation and affirming that subsequent moves will strictly depend on incoming economic data.
Store of Value and Central Bank Reserve Accumulation
Throughout historical commerce, gold has served as an essential store of value and a universal medium of exchange. In contemporary finance, its role extends well beyond ornamental jewelry, functioning primarily as a premier safe-haven asset sought out during periods of market stress and geopolitical conflict. Because it carries no sovereign credit risk and relies on no single government issuer, physical gold remains a primary hedge against currency devaluation and persistent inflation.
Official monetary authorities represent the world's largest holders of bullion. In efforts to reinforce institutional credibility and insulate national currencies against external shocks, central banks routinely diversify foreign reserves by acquiring gold. Data from the World Gold Council shows that central banks accumulated 1,136 tonnes of gold valued at approximately $70 billion into sovereign vaults in 2022, marking the highest annual total since tracking began. Emerging market central banks, particularly those of China, India, and Turkey, have been actively expanding their gold stockpiles to bolster economic stability.
Currency Interactions and Macro Correlations
Gold maintains an inverse relationship with both the US Dollar and US Treasury debt, which themselves represent the dominant global reserve assets. When the US Dollar weakens, bullion becomes more affordable for holders of foreign currencies, prompting increased international demand. Similarly, gold historically shares an inverse correlation with speculative risk assets; equity bull markets typically divert capital away from metals, whereas widespread equity corrections often funnel liquidity back into safe havens. While systemic fear can spark rapid speculative rallies in gold, sustained dollar strength and elevated interest rate environments remain the principal forces capping its upward potential.