























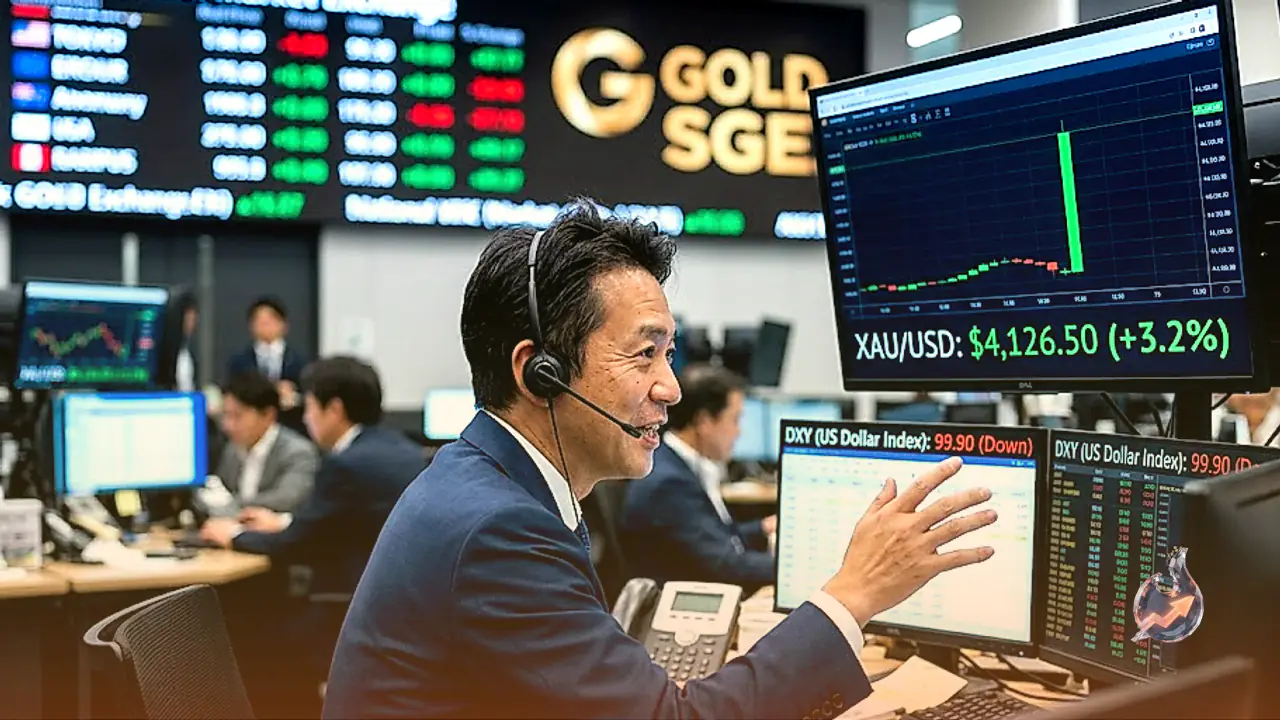

Gold prices surged sharply in international markets as a steep decline in the US Dollar drove investors toward safe-haven assets. The US Dollar Index (DXY), which gauges the Greenback against a basket of six major foreign currencies, slid by nearly 0.90% to trade around 99.90. Intense market speculation regarding intervention by Japanese monetary authorities to prop up the Yen triggered a broad sell-off in the American currency. Taking advantage of the dollar's retreat, spot gold touched a five-day high of $4,126 per ounce, successfully breaking above the critical $4,100 psychological threshold after posting solid back-to-back daily gains.
Live market data indicates that gold continues to hold firm around $4,161 per ounce, reflecting a 3.13% advance from its previous daily close of $4,035. Trading activity registered a massive spike, with daily volume expanding to 19.15 times its 20-day average. Over the past 52 weeks, gold has traversed a wide price channel between $3,264 and $5,586. The current rebound underlines renewed buying interest following a brief consolidation phase, supported by a combination of macroeconomic headwinds and geopolitical uncertainties.
Cooling Inflation and Sluggish GDP Growth Weaken Fed Hawkishness
A fresh batch of economic indicators released in the United States pointed to cooling economic momentum, reinforcing expectations that the Federal Reserve may pause its monetary tightening campaign. According to data published by the Bureau of Economic Analysis, the Fed's preferred inflation metric—the Core Personal Consumption Expenditures (PCE) Price Index—slowed from 3.4% to 3.3% year-over-year in June, matching consensus estimates. The headline PCE price index also decelerated, easing from 4.1% in the prior month to 3.7% year-over-year.
Compounding the softer inflation narrative, the Commerce Department reported that the US Gross Domestic Product (GDP) grew at an annualized rate of 1.5% in the second quarter of 2026. This print missed Wall Street forecasts of 2.1% growth by a wide margin, primarily dragged down by a widening trade deficit. The combination of moderating consumer prices and slowing economic expansion has led market participants to reevaluate the likely trajectory of future US monetary policy, removing fuel from the dollar's recent rally.
Money Markets Trim September Rate Hike Odds as Yield Premium Remains
Realigning with the weaker macroeconomic backdrop, financial money markets swiftly repriced their expectations for the Federal Reserve's upcoming September policy decision. Prime Terminal data reveals that the probability of a 25-basis-point interest rate hike in September has dropped to a slim 30%. Conversely, the likelihood of the central bank opting for a rate hold has jumped sharply to 70%. Because gold pays no yield, a lower interest rate environment naturally enhances its relative appeal against interest-bearing paper assets.
Nevertheless, long-dated US Treasury yield premiums remain somewhat elevated due to ambiguous policy guidance offered by Fed officials regarding the long-term terminal rate. Investors are now turning their attention to the upcoming University of Michigan Consumer Sentiment index release on Friday, seeking further clarity on consumer inflation expectations and overall economic confidence. In the short term, broad-based weakness in the US Dollar continues to provide a sturdy floor for bullion prices.
Gulf War Hostilities and Crude Oil Dynamics
Escalating geopolitical risks in the Middle East have added another layer of support for gold's safe-haven appeal. A resumption of hostilities in the Gulf War has re-ignited fears of energy supply disruptions and potential cost-push inflation. West Texas Intermediate (WTI) crude, the US benchmark, dipped 1% on the session to trade at $83.59 per barrel, but remains up by nearly 20% across the month of July.
Surging energy prices pose a dual challenge for central bankers by threatening economic growth while keeping inflation sticky. During periods of heightened geopolitical confrontation and potential stagflation, market participants historically rotate out of equities and risk assets into physical commodities. Gold's longstanding reputation as an inflation hedge and store of value makes it a primary beneficiary when geopolitical friction threatens global trade corridors.
Technical Outlook: Key Resistance and Support Boundaries
From a technical standpoint, gold's push past the $4,100 mark has shifted short-term momentum in favor of market bulls. The Relative Strength Index (RSI) crossed above the neutral 50 line to register at 54, signaling that buyers are taking control. Simultaneously, the Moving Average Convergence Divergence (MACD) indicator exhibits a bullish configuration, with the histogram printing at 18.98 as the MACD line (-33.27) sits comfortably above the signal line (-52.25). Stochastic indicators show the fast line at 91 against a signal line of 56.
To maintain its upward trajectory, gold buyers must clear initial resistance at the July 22 peak of $4,165. A decisive close above this hurdle would open the door for a test of the 50-day Simple Moving Average (SMA) located near $4,194 (with live EMA50 at $4,212 and SMA50 at $4,211), followed by the July 6 swing high of $4,202. On the downside, immediate technical support rests at $4,100. A breakdown below this level would expose the July 24 low of $4,022, ahead of the psychological $4,000 floor and the June 17 low of $3,959. The 14-day Average True Range (ATR) currently stands at 72.90, defining the average daily price fluctuation span.
Historical Reserve Role and Central Bank Buying Trends
Throughout human history, gold has served as an enduring store of wealth and an internationally accepted medium of exchange. Unlike fiat currencies, bullion carries no counterparty or credit risk, as its value is not tied to the solvency of any sovereign government or corporate entity. Consequently, it remains a premier portfolio diversification tool during periods of currency devaluation, high inflation, and structural economic instability.
Central banks represent the single largest institutional category of gold holders worldwide. To protect national currency stability and reinforce public confidence during financial distress, monetary authorities systematically build up gold reserves. According to data compiled by the World Gold Council, central banks accumulated a record-breaking 1,136 tonnes of gold valued at approximately $70 billion in 2022. This represented the highest annual level of central bank net purchases since official record-keeping began, driven primarily by emerging market central banks including China, India, and Turkey.
Broad Foreign Exchange Developments: EUR/USD and GBP/USD Hit Multi-Week Highs
The sell-off in the Greenback echoed across major foreign exchange pairs. The British Pound (GBP/USD) gained significant bullish momentum, climbing past 1.3450 to reach fresh multi-week highs. The Bank of England's Monetary Policy Committee (MPC) voted 6-3 to maintain its benchmark interest rate unchanged at 3.75%, with three dissenting members voting in favor of a rate hike. The combination of hawkish dissent in London and disappointing US GDP figures propelled Cable higher ahead of the monthly close.
Similarly, EUR/USD surged toward 1.1530 during the American trading session, marking a fresh six-week high. A divided stance within the Federal Reserve alongside softer macroeconomic data has placed sustained selling pressure on the dollar. Because international commodities are denominated in US Dollars (XAU/USD), a weaker Greenback makes gold cheaper for foreign currency holders, creating a direct mechanical impulse that propels gold prices higher across global exchanges.