























Gold reversed its earlier gains and faced selling pressure as the US Dollar steadied ahead of upcoming producer inflation data from the United States. Market participants are carefully evaluating whether a hotter-than-expected Producer Price Index report could cement expectations for a Federal Reserve interest rate hike during the central bank's policy meeting next week.
Economists anticipate that US producer inflation rebounded in August following a flat reading in July. Headline PPI is projected to increase 0.4% on a monthly basis, pushing the annual rate higher to 5.3% from 4.7% previously. Meanwhile, core PPI, which strips out volatile components like food and energy, is expected to post a 0.3% monthly gain compared to 0.2% prior, while the annual core figure is forecasted to accelerate to 4.6% from 4.2%.
According to data from the CME FedWatch Tool, market traders have priced in roughly a 62% probability of a rate hike at the upcoming policy announcement. However, most economists surveyed by Reuters continue to expect the central bank to keep benchmark borrowing costs unchanged through the remainder of the year. Because gold is a non-yielding asset, it typically thrives in low-interest-rate environments where the opportunity cost of holding the precious metal remains minimal.
Strategists at DBS point out that an energy-driven inflationary squeeze presents a complex challenge, potentially forcing the central bank to manage inflation expectations while simultaneously avoiding excessive damage to economic growth, though a credible policy response could ultimately support the greenback.
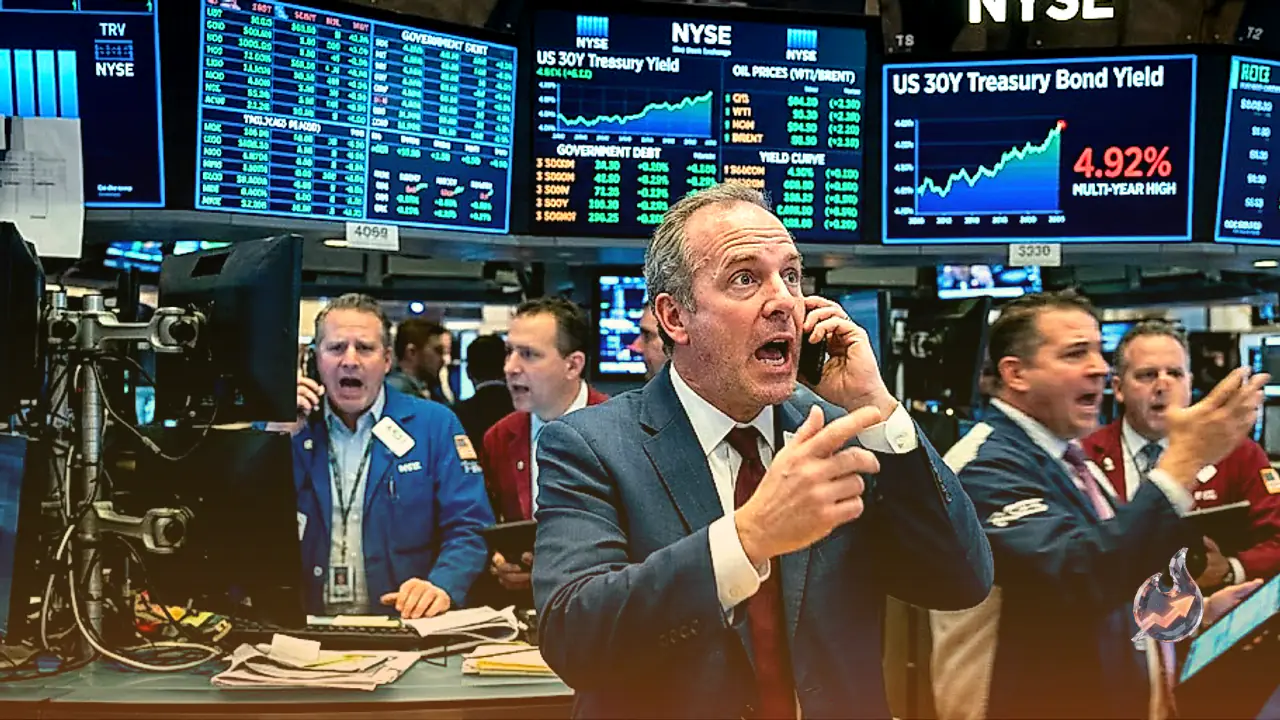
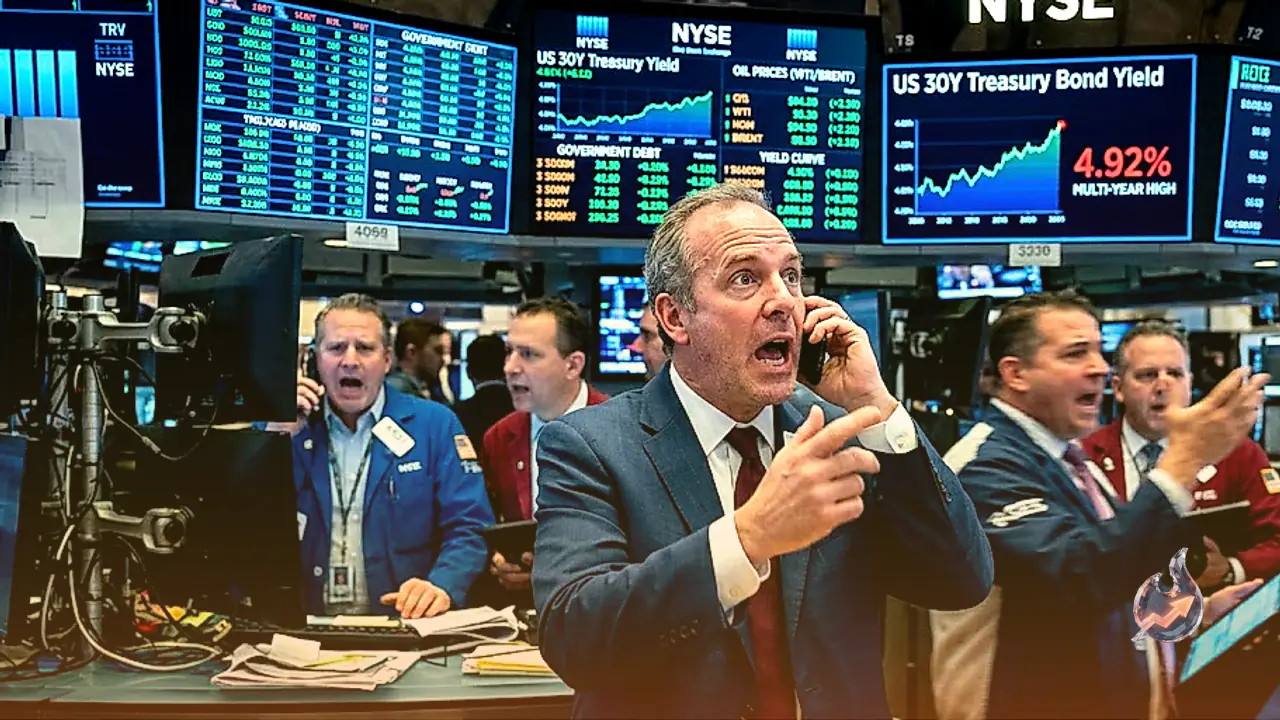
The US Dollar Index, which measures the currency against a basket of six developed peers, trades near 98.90 after bouncing back from an intraday low of 98.71. Concurrently, gold is grappling with headwinds from rising US Treasury yields. The benchmark 10-year yield hovers near 4.85%, marking its highest level since November 2023, following a Treasury bond buyback initiative that failed to enthral investors.
In the immediate term, the precious metal remains susceptible to shifting monetary policy expectations and elevated yields, while ongoing geopolitical tensions in the Middle East provide limited safe-haven traction.
On the daily technical charts, XAU/USD continues to trade above its 50-day and 100-day Simple Moving Averages, offering underlying trend support, though it remains capped underneath the 200-day SMA near the $4,538 threshold.
Live market data indicates that gold currently changes hands at $4,423, compared to the previous close of $4,416, representing a slight gain of 0.16% within a 52-week trading band spanning from $3,618 to $5,586. Momentum indicators such as the 14-period Relative Strength Index sit at 52, reflecting neutral momentum, while the Moving Average Convergence Divergence indicator reads negatively below the zero line, suggesting that upside rallies could encounter persistent selling pressure.
Immediate resistance on the topside is identified at the 200-day moving average near $4,538, with a decisive break opening the path toward the horizontal resistance barrier around $4,700. On the downside, initial support emerges near the recent price pivot zone, backed by the 100-day SMA at approximately $4,340 and the 50-day SMA near $4,266. A more pronounced breakdown would expose the major psychological and technical floor at $4,000.
Inflation metrics measure changes in the cost associated with purchasing a representative basket of goods and services over a given timeframe. Headline figures capture overall changes, whereas core metrics exclude volatile food and fuel categories that frequently fluctuate due to seasonal and geopolitical factors. Central banks mandate policy around maintaining stable inflation near a target of 2%.
The Consumer Price Index similarly tracks consumer-level price shifts, where persistent readings above the 2% target typically prompt monetary tightening in the form of higher interest rates. Although higher rates tend to strengthen a currency by attracting foreign capital inflows seeking superior yields, they simultaneously increase the opportunity cost for holding non-yielding bullion.
Historically viewed as a premier hedge against rampant inflation, gold's relationship with high inflation has evolved. When surging inflation prompts central banks to aggressively raise interest rates, the resulting high-yield environment diminishes the appeal of holding gold compared to interest-bearing cash deposits, whereas cooling inflation often paves the way for lower rates and a renewed rally in precious metals.