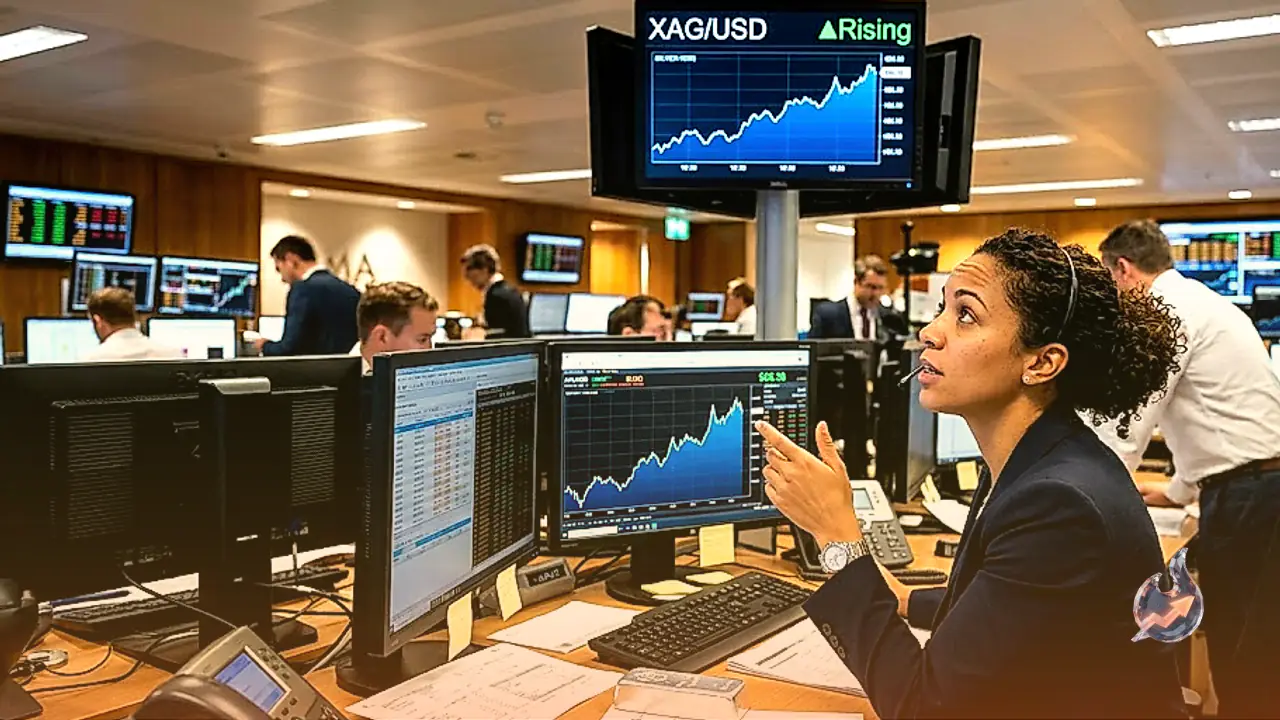

























Gold prices registered a notable recovery after pulling back to a one-week low near the $4,340 to $4,345 zone during Asian market trading. The rebound in the precious metal snapped a three-day losing streak, drawing structural support from widespread weakness in the US Dollar (USD). The Greenback remained under noticeable selling pressure, influenced largely by a sharp appreciation in the Japanese Yen (JPY). Despite this temporary price bounce, market analysts emphasize that upside momentum for non-yielding bullion remains capped. Persistent expectations surrounding potential monetary tightening by the Federal Reserve, combined with key economic indicators, continue to weigh on investor sentiment. Live exchange data places Gold (GC=F) trading around $4,421 per ounce, reflecting a 0.61% increase from its previous session close of $4,394, with daily trading volume surging to 10.56 times its 20-day historical average.
Dollar Weakness Driven by Foreign Exchange Movements
The primary driver behind gold's sudden stabilization is the recent softness observed across the US Dollar Index. The Greenback hovered near its lowest valuation in over two weeks, driven lower by strong gains in foreign currencies, particularly the Japanese Yen. The Japanese Yen experienced a substantial surge following indications of policy normalization from the Bank of Japan (BoJ). This movement was further reinforced by robust figures from the Reuters Tankan business survey, which highlighted improving corporate confidence in Japan and amplified expectations of further central bank rate adjustments.
As foreign currencies strengthen against the American currency, dollar-denominated assets such as precious metals become relatively more affordable for international investors holding other currencies. This currency dynamic provided immediate buyers at lower price tiers. However, financial strategists caution that dollar weakness may face structural resistance if US economic performance remains resilient compared to other major industrial nations, keeping foreign exchange markets in a delicate balance ahead of major economic data releases.
Federal Reserve Rate Expectations and Economic Data
Market participants remain heavily focused on the future path of monetary policy set by the Federal Reserve. Institutional strategists at BNY highlighted that recent labor market figures have solidified expectations regarding additional monetary tightening. Following an exceptionally strong non-farm payrolls report released on Friday, market expectations for a rate hike at the upcoming September policy meeting have bounced back above 60%. Although comments from Federal Reserve Governor Christopher Waller on Thursday initially introduced brief market hesitation, analysts maintain that economic conditions strongly favor an imminent rate adjustment.
The prospect of higher interest rates presents a traditional headwind for precious metals. Because gold is a non-yielding asset that offers no regular coupon or dividend payout, elevated interest rates increase the opportunity cost of holding bullion compared to yield-bearing instruments such as US Treasury bonds. Consequently, even as currency fluctuations provide immediate price floors, hawkish policy expectations prevent aggressive buying sprees from taking hold across derivative and spot commodity markets.
Technical Chart Analysis and Key Price Boundaries
From a technical analysis perspective, gold found critical buying interest near the $4,345 to $4,340 confluence region. This support zone is formed by the 200-period Simple Moving Average (SMA) on the 4-hour chart, aligning closely with the 50.0% Fibonacci retracement level of the upswing recorded between July and August. Technical analysts view this price intersection as a crucial pivotal barrier determining medium-term market trajectory.
Live technical indicators present a neutral to cautious outlook. The 14-day Relative Strength Index (RSI) is currently hovering around 52, recovering from its earlier neutral reading of 42. Meanwhile, the Moving Average Convergence Divergence (MACD) indicator remains in negative territory with a main line at 41.42 against a signal line of 66.77, creating a negative histogram reading of -25.34. Additional technical metrics show a 20-day Exponential Moving Average (EMA) at $4,423, a 50-day EMA at $4,355, and a 200-day EMA at $4,371. The 50-day Simple Moving Average stands at $4,253, while the 200-day SMA is located at $4,524. Bollinger Bands delineate an upper resistance band at $4,668 and a lower support band at $4,274, with a middle band at $4,471. Daily volatility measured by the Average True Range (ATR) stands at 76.96. Immediate pivot analysis identifies pivot point $4,411, resistance levels R1 at $4,438 and R2 at $4,455, and support levels S1 at $4,394 and S2 at $4,367. The presence of these technical parameters indicates that recent gains represent a price stabilization above key support rather than the initiation of an aggressive bullish breakout.
Central Bank Policy Frameworks and Monetary Mechanics
Understanding the broader trajectory of precious metals requires examining the policy framework governing the Federal Reserve. The central bank operates under a statutory dual mandate established by Congress: maintaining price stability and fostering maximum sustainable employment. To fulfill these objectives, the Federal Reserve adjusts the federal funds rate, which serves as the benchmark for borrowing costs across the global financial system.
When inflation accelerates beyond the target 2% threshold, the Federal Reserve implements monetary tightening by raising interest rates. Higher borrowing costs curb consumer and corporate spending, dampening inflationary pressures while simultaneously bolstering the value of the US Dollar by attracting yield-seeking capital. Conversely, when economic growth slows or inflation undershoots expectations, policy makers reduce interest rates to stimulate economic activity, which typically exerts downward pressure on the US Dollar.
Policy decisions are formulated by the Federal Open Market Committee (FOMC), which convenes eight scheduled meetings annually. The voting committee consists of twelve members, including the seven governors of the Federal Reserve Board, the president of the Federal Reserve Bank of New York, and a rotating group of four regional Reserve Bank presidents serving one-year terms. In extreme economic conditions, the Federal Reserve can deploy non-standard monetary policy tools such as Quantitative Easing (QE), a liquidity-injection process extensively utilized during the 2008 Great Financial Crisis involving large-scale bond purchases that tend to weaken the US Dollar. Conversely, Quantitative Tightening (QT) reduces the central bank balance sheet by halting reinvestments, which generally reinforces dollar strength.
Broader Market Dynamics Across Foreign Exchange and Energy
The broader financial landscape exhibits significant cross-market developments. In foreign exchange markets, AUD/USD maintained a consolidative price structure above the 0.7200 level. The currency pair remained resilient despite elevated Consumer Price Index (CPI) and Producer Price Index (PPI) releases from China, supported by rising expectations that the Reserve Bank of Australia (RBA) may pursue interest rate increases. Concurrently, USD/JPY experienced persistent selling pressure, hovering near a seven-month low established on Tuesday as Japanese corporate sentiment improved.
In energy markets, refined products displayed pronounced volatility despite relative calm in crude oil benchmark trading. The US diesel crack spread, which measures the differential between ultra-low sulfur diesel futures and West Texas Intermediate (WTI) crude oil, surged past $100 per barrel for the first time on record, reaching an intraday high of $102.00 per barrel. These wide-ranging shifts across currency and energy markets underscore the complex macroeconomic environment currently influencing precious metals.