





















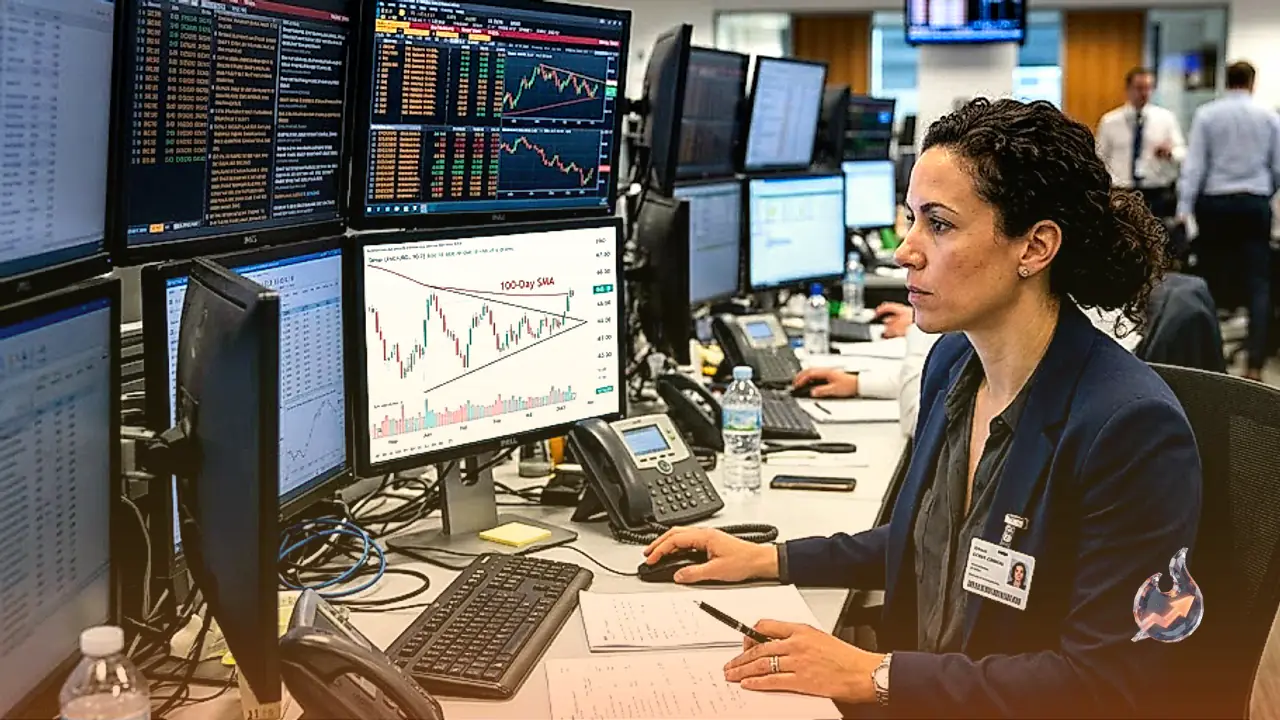

Silver prices have encountered stiff barrier action around the 100-day Simple Moving Average (SMA), capping the metal's upward progress and confirming a phase of narrow consolidation. The precious commodity experienced a modest pullback after failing to carve out a clean technical break above the 100-day SMA located at $66.39. Backed by a neutral and flat Relative Strength Index (RSI), price action reflects consolidation between core moving averages. A decisive close above the $66.39 mark could expose the $70.00 psychological threshold and the 200-day SMA at $73.19. For the moment, the commodity remains confined within a boundary bounded by the 100-day SMA at $66.39 and the 50-day SMA at $63.15.
Technical Architecture and Key Breakout Levels
The sequence of descending swing lows and descending swing highs that characterized the market structure earlier was interrupted when silver failed to test the August 3 daily floor of $56.57. A breakdown below that level had the potential to extend downside losses toward the July 17 swing bottom at $54.77. Because the metal held above that territory and is currently pressing near the upper limits of its range, clearing the 100-day SMA could unleash additional bullish momentum. Overcoming the $66.39 ceiling would direct buyer focus directly toward $70.00, followed closely by the 200-day SMA sitting at $73.19. Should weakness persist, immediate support is provided by the 50-day SMA at $63.15 ahead of the psychological $60.00 round figure. Any deeper drop below this support foundation would expose the July 17 cycle low of $54.77.
Live Technical Readings and Indicator Matrix
Live market metrics show silver trading at $66.53 at the closing bell, representing a minor drop of 0.04 percent from the prior close of $66.56. The 52-week trading envelope spans between $43.30 and $121.30, accompanied by active market turnover registering 10.72 times the 20-day volume average. The 14-day RSI reads 55, reflecting balanced momentum. The MACD stands at 0.28 against its signal line of 0.42, generating a negative histogram reading of -0.14. Trend analysis across exponential moving averages shows the 20-day EMA at $65.43, the 50-day EMA at $65.05, and the 200-day EMA at $66.78. Meanwhile, the 50-day SMA is located at $63.07 and the 200-day SMA at $72.53. The positioning of the EMA50 below the EMA200 denotes a death cross formation, pointing to an ongoing broader downtrend. Bollinger Bands range between $62.66 and $69.63 with a midline of $66.14, with prices navigating inside the bands. The 14-day ADX sits at 15, confirming a range-bound environment. Stochastic measures place the fast line at 69 and the signal line at 56, while the 14-day ATR of 1.70 outlines prevailing daily price volatility. Established 20-day support sits near $63.02 alongside resistance near $71.16. Daily pivots locate central support-resistance pivot at $66.76, upward resistance barriers at R1 $67.32 and R2 $68.12, and downside support cushions at S1 $65.97 and S2 $65.41.
Drivers of Precious Metal Valuation and Safe-Haven Appeal
Silver has functioned throughout history as a tangible store of value and an accepted medium of exchange. While gold captures mainstream attention, silver remains a core instrument for investors seeking portfolio diversification, tangible intrinsic backing, and inflation protection during periods of aggressive monetary expansion. Market participants engage with physical products such as bullion coins and cast bars, or execute trades via Exchange Traded Funds (ETFs) tracking international spot benchmarks. Geopolitical turmoil and concerns surrounding deep economic contraction tend to elevate silver's price profile due to its safe-haven classification, though usually with less intensity than gold. Being a non-yielding asset, silver benefits from lower prevailing interest rates. Its pricing in dollars (XAG/USD) also ties its performance closely to the US Dollar. Dollar appreciation suppresses silver valuations, whereas greenback weakness typically drives price advances. Mine production levels, where silver exists in significantly greater abundance than gold, and scrap recycling rates constitute additional supply-side determinants.
Industrial Absorption and Macroeconomic Consumption
Industrial demand differentiates silver from other monetary metals. Boasting the highest electrical conductivity of any metal, outstripping both copper and gold, silver is an indispensable component in electrical manufacturing, consumer electronics, and solar photovoltaic panels. Fluctuations in manufacturing activity directly impact overall market balance. Economic trends across the United States, China, and India play a pivotal role in dictating price swings. Massive industrial complexes across the United States and China absorb considerable quantities of silver across various production stages. Meanwhile, consumer appetite in India centers heavily on retail jewelry and traditional fabrications, providing substantial support to global physical demand and clearing prices.
Gold Interplay and Relative Ratio Dynamics
Silver price movements regularly track gold because both assets respond to parallel safe-haven impulses and financial conditions. Analysts and market operators track the Gold/Silver ratio, which defines the exact volume of silver ounces needed to match the value of one troy ounce of gold. This relationship assists traders in determining relative price parity between both assets. An elevated ratio is widely interpreted as a potential signal that silver is undervalued or that gold has reached stretched valuation territories. Conversely, a depressed ratio indicates that gold may be undervalued relative to silver, helping traders allocate exposure across the precious metals complex.
Broader Financial Landscape and Macroeconomic Backdrop
Global financial markets are traversing an unusual juncture during the concluding weeks of the third quarter, dominated by heightened volatility alongside falling crude oil prices and anticipations of stronger equity openings across the United States and Europe. Government bond markets have absorbed considerable strain, with European and US sovereign yields climbing after volatility late last week. Central bank actions continue to ripple through foreign exchange, as the Bank of Japan advanced its monetary policy normalisation by lifting its short-term policy rate to 1.25% from 1.00% in a 7-2 vote, matching expectations. Gold trades quietly near $4,350 per troy ounce against a firmer US Dollar despite softer Treasury yields across the curve. Currency pairs reflect these divergent trends: the Australian Dollar is consolidating in the low 0.7100s after testing 0.7140, pressured by broader dollar strength, while USD/JPY has dipped below 157.00 under potential intervention caution and ongoing geopolitical tensions spanning Eastern Europe and the Middle East.