






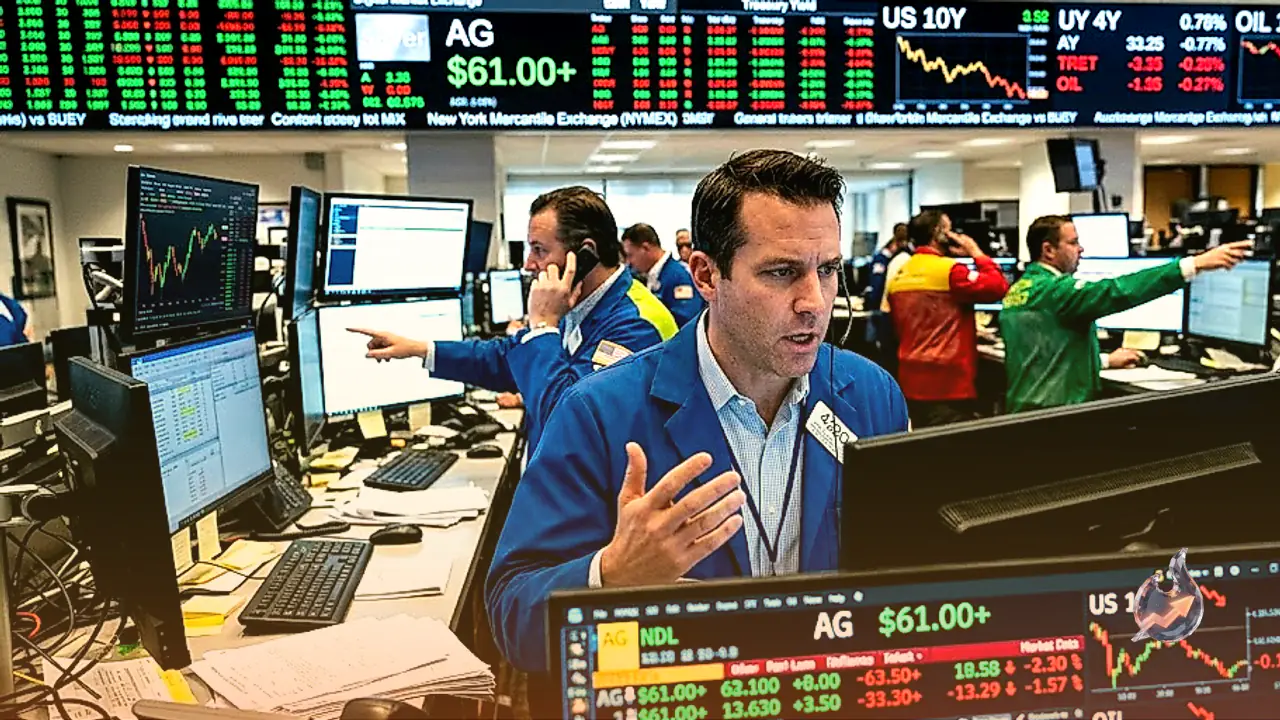
















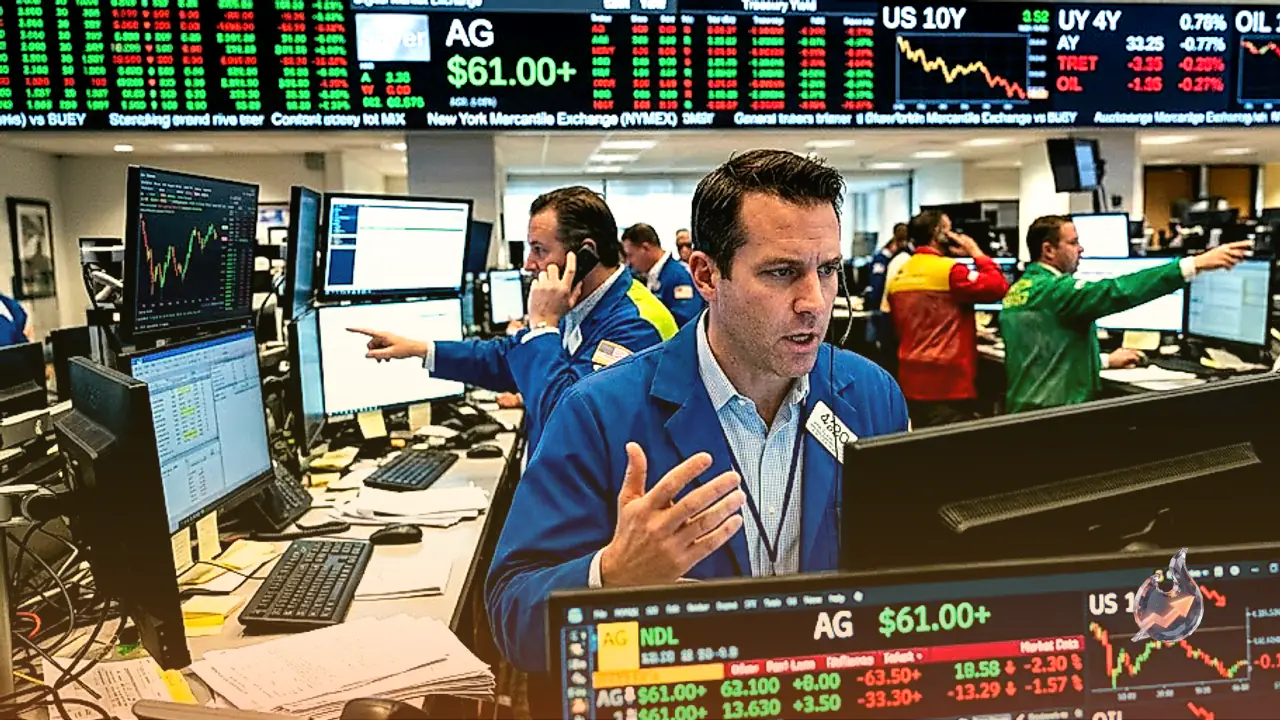

Silver consolidated its recent advances during Monday's Asian trading session, hovering near $61.10 per ounce as global financial markets responded to shifting geopolitical dynamics and bond market movements. The white metal managed to preserve the momentum established at the close of last week, drawing support primarily from a retreat in United States Treasury yields triggered by falling crude oil prices following a newly announced energy truce between Russia and Ukraine.
Temporary Truce Halts Strikes on Energy Infrastructure
Over the weekend, US President Donald Trump announced via a post on Truth Social that both Moscow and Kyiv had concluded an energy ceasefire. Under this temporary arrangement, both nations agreed to halt attacks aimed at energy facilities. Ukrainian forces had been carrying out extensive strikes against Moscow's energy infrastructure in an effort to curtail funding for the conflict. In his post, President Trump declared that an energy ceasefire between Russia and Ukraine had taken effect immediately, noting that both parties had agreed to the terms and urging them not to violate it.
The announcement followed remarks made by President Trump on Friday regarding a framework established with Russian President Vladimir Putin to facilitate diesel shipments from Russia in stages. The temporary suspension of attacks on energy targets brought visible relief to international markets, which had been navigating intense supply constraints amplified by ongoing tensions across the Middle East.
Plunging Oil Prices Ease Pressure on Treasury Yields
Crude markets reacted promptly to the diplomatic developments. West Texas Intermediate oil prices fell approximately 2% to trade near $89.00 per barrel. The downward trajectory in crude eased immediate inflation anxieties, pulling the benchmark 10-year US Treasury yield down toward 5.24%. Just days earlier, the yield had touched 5.36%, marking a high not seen in over two decades. Cash trading in US government debt was shuttered on Monday in observance of Columbus Day, leading to subdued liquidity across related asset classes. Lower bond yields generally enhance the appeal of non-yielding physical commodities like silver.
Technical Indicators Point to Short-Term Consolidation
On the daily spot chart, silver traded at $61.02 per ounce, retaining a defensive bias in the immediate term as spot prices stayed beneath the 20-day Exponential Moving Average located at $62.07. After retreating from recent swing highs, the metal's position below this short-term trend indicator implies that upward attempts may encounter renewed selling. The 14-day Relative Strength Index hovered near 44, holding within a neutral-to-soft zone that indicates lingering downward pressure rather than an oversold market.
Immediate chart resistance aligns with that 20-day EMA at $62.07. Technical analysts note that a daily settlement above this threshold would be essential to neutralize the prevailing downward bias and create room for a broader rebound. Without nearby support parameters provided on the chart, market participants remain focused on price interaction around the moving average. Inability to reclaim this technical level could leave silver exposed to further tests of previous price lows.
Live Technical Metrics and Trading Levels
Current close-bell market data reveals that active silver futures (SI=F) trade at $61.29, up 1.02% from the preceding close of $60.67, within an extensive 52-week band spanning $45.85 to $121.30. Trading activity surged, with turnover reaching 10.43 times the 20-day average volume. Momentum indicators show the 14-day RSI at 45, while the MACD reads -1.23 against a signal line of -1.09, resulting in a bearish histogram reading of -0.14.
Trend indicators illustrate broader downward momentum. The 20-day EMA rests at $62.01, the 50-day EMA stands at $63.36, and the 200-day EMA is recorded at $67.48. Meanwhile, the 50-day Simple Moving Average is positioned at $64.18 alongside a 200-day SMA of $72.45. A death cross configuration is evident as the 50-day EMA trades below the 200-day EMA, confirming a prevailing long-term downtrend. The 20-day Bollinger Bands encompass a range between $57.82 and $67.09 around a middle baseline of $62.45, with current prices holding inside these bounds. The 14-day Average Directional Index stands at 21, reflecting weak trend strength or range-bound conditions, while the Stochastic oscillator displays a fast line at 33 and a signal line at 19. Daily volatility, measured by the 14-day Average True Range, is 1.40, serving as an appropriate stop-loss buffer. Chart support over 20 sessions sits near $58.92 against resistance at $66.94. Key trading marks place the central pivot at $61.37, resistance levels at $61.67 (R1) and $62.05 (R2), and downside support at $60.99 (S1) followed by $60.69 (S2).
Core Fundamentals Driving the White Metal
Silver occupies a unique dual role in the financial ecosystem, acting both as a wealth-preservation asset and an industrial workhorse. Throughout history, market participants have utilized it as a medium of transaction and a reliable store of value. While gold commands greater prestige as an ultimate reserve asset, investors frequently turn to silver to achieve balance in diversified portfolios, seeking its intrinsic value or using it as a buffer against inflationary cycles. Market access ranges from holding physical bars and minted bullion coins to trading exchange-traded funds that track real-time benchmark pricing.
Valuation swings in silver reflect an intricate matrix of market forces. Episodes of geopolitical instability or warnings of severe macroeconomic downturns can lift silver as capital seeks defensive assets, though its price response is generally more volatile than that of gold. Because silver does not generate interest yield, environment characterized by softening rates or lower bond yields typically benefits the metal. Currency dynamics also play a central role given that transactions are settled in US dollars. A rising greenback increases the acquisition cost for holders of foreign currencies and curbs demand, whereas dollar weakness often acts as a price catalyst. Additional structural influences include commercial mine output, where silver occurs in greater abundance than gold, as well as industrial scrap recycling volumes.
Industrial Applications and Regional Demand Dynamics
Industrial demand distinguishes silver from other monetary metals. Owing to its peerless electrical conductivity, which exceeds that of copper and gold, silver is indispensable in modern electronics manufacturing and solar photovoltaic hardware. Surges in high-tech industrial orders can tighten physical availability and elevate spot prices, whereas economic stagnation often exerts downside drag.
Macroeconomic trends across major global economies exert profound influence on silver's price path. Industrial giants like the United States and China consume substantial volumes of refined silver across advanced manufacturing sectors. Concurrently, Indian consumer patterns heavily sway physical demand, where traditional cultural preferences for silver jewelry, ornaments, and festive purchases provide significant retail absorption.
Historically, silver follows the overarching direction set by gold. When bullish sentiment envelops the yellow metal, silver typically tracks higher as safe-haven capital rebalances. Traders closely monitor the gold-to-silver ratio, which calculates the quantity of silver ounces required to acquire one ounce of gold, to gauge relative market valuations. An elevated reading often signals that silver may be undervalued relative to gold, whereas a depressed ratio can indicate that gold represents the more attractive relative value.
Broader Currency Action and Bullion Inflows
Across the wider foreign exchange and commodity complex, trading activity exhibited measured ranges amid holiday closures in Tokyo and the United States. The Australian dollar attempted to recover from a minor downward gap but stayed capped below 0.7000 as dollar resilience and diminished prospects of a November rate increase by the Reserve Bank of Australia checked upward progress. In Tokyo, USD/JPY held above 158.00 as market participants weighed potential intervention by Japanese monetary authorities against headwinds caused by declining Treasury yields.
In contrast, spot gold advanced toward $4,215 per ounce during early Asian dealings. The metal drew momentum from capital allocations into gold-backed exchange-traded funds alongside softening yields, with investment inflows reaching a four-year peak according to Bloomberg metrics. Market attention now pivots firmly toward Wednesday's release of the United States September Consumer Price Index report, which is anticipated to provide critical clues regarding the subsequent direction of interest rate policy.